Filing Flows › Industrials › CHS (CHSCP)
CHS (CHSCP) earnings and revenue breakdown
Latest: Q4 FY26 · 10-K filed Nov 4, 2026 · CHS (CHSCP) Q4 FY26 earnings results →
Q4 FY26 Revenue up 21% year over year to $10.4B · 7¢ of every $1 of revenue kept as net profit · operating margin 5.8%
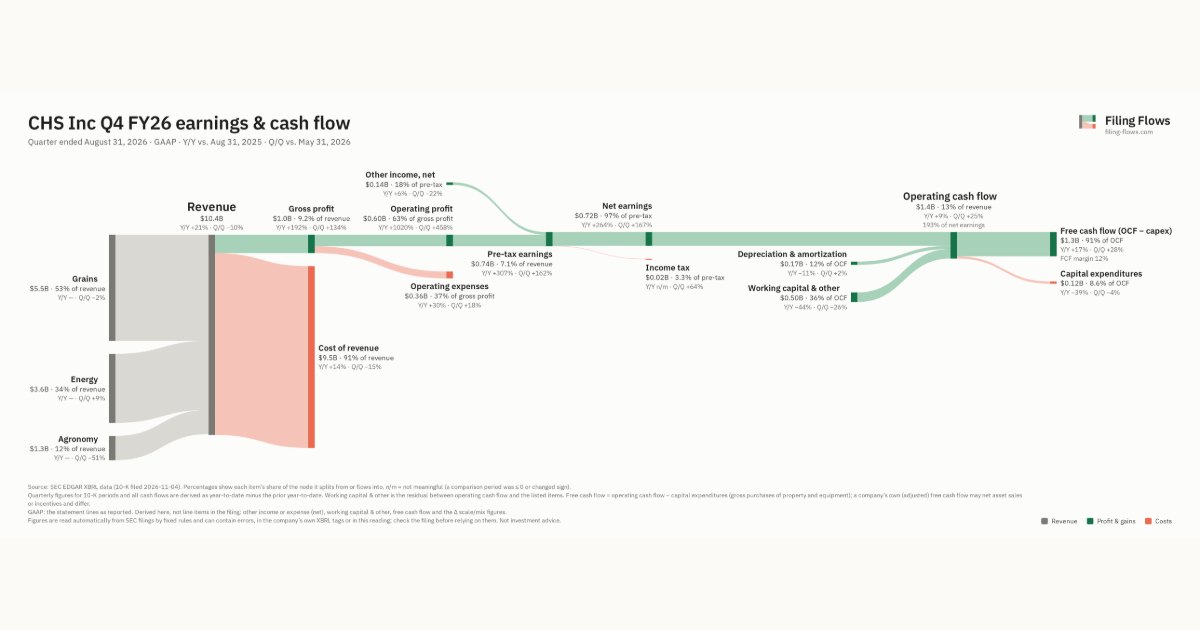
CHS made $10.4B in Q4 FY26 (+21% Y/Y): Grains $5.5B, Energy $3.6B, Agronomy $1.3B. Operating margin 5.8%, net earnings $715M. See where every dollar goes — costs, profit and cash — as a Sankey from the 10-K filed Nov 4, 2026.
Drawing the Sankey…
Open the interactive Sankey → click any line for what the company wrote about it, compare Y/Y and Q/Q, export as PNG or PDF
What changed this quarter
Revenue was $10.4B in Q4 FY26, up 21% year over year and down 10% from the previous quarter. Grains was the largest line at 53% of revenue.
Gross margin was 9.2%, up 5.4 points from Q4 FY25. Operating profit was $0.60B, a 5.8% margin (up 5.2 points year over year). Of the extra revenue versus Q4 FY25, 30% reached operating profit, above the 1% margin then. Operating expenses grew 30% against revenue growth of 21%. Net earnings were $0.72B, up 264% year over year. The effective tax rate was 3.3%.
Operating cash flow was $1.4B (up 9% year over year), 193% of net earnings. Non-cash charges added back $0.17B of depreciation and amortization. Working capital and other items added $0.50B. Capital expenditures of $0.12B left free cash flow of $1.3B.
Quarterly history
| Quarter | Form | Filed | Revenue | Y/Y | Op. margin | Net earnings | Op. cash flow |
|---|---|---|---|---|---|---|---|
| Q4 FY26 | 10-K | Nov 4, 2026 | $10.4B | +21% | 5.8% | $715M | $1.4B |
| Q3 FY26 | 10-Q | Jul 8, 2026 | $11.6B | +19% | 0.9% | $267M | $1.1B |
| Q2 FY26 | 10-Q | Apr 8, 2026 | $8.4B | +7% | -2.9% | −$147M | −$569M |
| Q1 FY26 | 10-Q | Jan 7, 2026 | $8.9B | -5% | 1.4% | $260M | −$338M |
| Q4 FY25 | 10-K | Nov 5, 2025 | $8.6B | -6% | 0.6% | $197M | $1.3B |
| Q3 FY25 | 10-Q | Jul 9, 2025 | $9.8B | +2% | 0.7% | $232M | $697M |
| Q2 FY25 | 10-Q | Apr 2, 2025 | $7.8B | -14% | -2.2% | −$76.0M | −$1.0B |
Charts
Interactive views
The same charts as the app — open one to draw it.
💵Where each $1 goesinteractive
Loading the interactive chart…
🌏Named in Asian annual reportsinteractive
Loading the interactive chart…
🔄Rotation against the market and its industry (RRG)interactive
Loading the interactive chart…
🔍Earnings qualityinteractive
Loading the interactive chart…
⚖️Fair value by methodinteractive
Loading the interactive chart…
🔭Outlook & guidanceinteractive
Loading the interactive chart…
📈Investments: gains and what it boughtinteractive
Loading the interactive chart…
🏭Its industry’s money flow (input-output)interactive
Loading the interactive chart…
About CHS
CHS Inc. (referred to herein as "CHS," "company," "we," "us" or "our") is the nation’s leading integrated agricultural cooperative, providing grain, food, agronomy and energy resources to businesses and consumers on a global basis. As a cooperative, we are owned by farmers, ranchers and member cooperatives (referred to herein as "members") across the United States. We also have preferred shareholders who own shares of our five series of preferred stock, which are listed and traded on the Global Select Market of The Nasdaq Stock Market LLC (“Nasdaq”). We buy grain and oilseeds from and provide products and services to our members (individual agricultural producers and local cooperatives) and other companies (nonmember customers) domestically and internationally.
In its own words, from its 10-K, filed Nov 4, 2026.
CHS against its Wholesale-Farm Product Raw Materials peers
The largest companies of the same SEC industry, each at its latest quarter. Revenue growth: +21% against the peers' median +6%. Operating margin: 5.8% against the peers' median 5.8%.
| Company | Quarter | Revenue | Y/Y | Op. margin |
|---|---|---|---|---|
| CHSCP CHS | Q4 FY26 | $10.4B | +21% | 5.8% |
| ANDE Andersons | Q3 2026 | $2.8B | +6% | 1.8% |
| SEB Seaboard | Q3 2026 | $2.8B | +9% | 0.5% |
| UVV Universal | Q2 FY27 | $617M | -18% | 6.9% |
| PYYX Pyxus International | Q2 FY27 | $534M | -6% | 7.5% |
Source: CHS 10-K on SEC EDGAR · CIK 823277 · Wholesale-Farm Product Raw Materials
Guidance and outlook
More on CHSCP
History
Every quarter: Q4 FY26 results · Q3 FY26 results · Q2 FY26 results · Q1 FY26 results · Q4 FY25 results · Q3 FY25 results · Q2 FY25 results