Filing Flows › Industrials › Dominos Pizza (DPZ)
Dominos Pizza (DPZ) earnings and revenue breakdown
Latest: Q3 2026 · 10-Q filed Oct 13, 2026 · Dominos Pizza (DPZ) Q3 2026 earnings results →
Q3 2026 Revenue up 3% year over year to $1.2B · 13¢ of every $1 of revenue kept as net profit · operating margin 20.4%
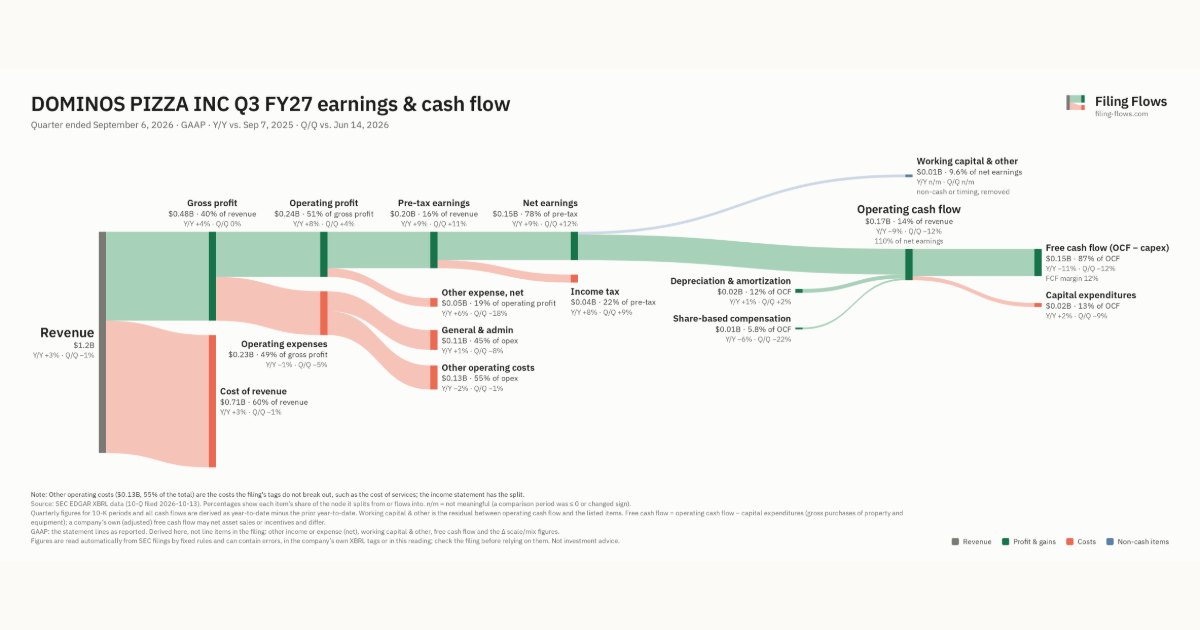
Dominos Pizza made $1.2B in Q3 2026 (+3% Y/Y). Operating margin 20.4%, net earnings $152M. See where every dollar goes — costs, profit and cash — as a Sankey from the 10-Q filed Oct 13, 2026.
Drawing the Sankey…
Open the interactive Sankey → click any line for what the company wrote about it, compare Y/Y and Q/Q, export as PNG or PDF
What changed this quarter
Revenue was $1.2B in Q3 2026, up 3% year over year and down 1% from the previous quarter.
Gross margin was 40.2%, up 0.1 points from Q3 2025. Operating profit was $0.24B, a 20.4% margin (up 0.9 points year over year). Of the extra revenue versus Q3 2025, 48% reached operating profit, above the 19% margin then. Operating expenses fell 1% while revenue rose 3%. Net earnings were $0.15B, up 9% year over year. The effective tax rate was 22.0%.
Operating cash flow was $0.17B (down 9% year over year), 110% of net earnings. Non-cash charges added back $0.02B of depreciation and amortization and $0.01B of share-based compensation. Working capital and other items used $0.01B. Capital expenditures of $0.02B left free cash flow of $0.15B.
Quarterly history
| Quarter | Form | Filed | Revenue | Y/Y | Op. margin | Net earnings | Op. cash flow |
|---|---|---|---|---|---|---|---|
| Q3 2026 | 10-Q | Oct 13, 2026 | $1.2B | +3% | 20.4% | $152M | $168M |
| Q2 2026 | 10-Q | Jul 20, 2026 | $1.2B | +4% | 19.4% | $136M | — |
| Q1 2026 | 10-Q | Apr 27, 2026 | $1.2B | +4% | 20.0% | $140M | $162M |
| Q4 2025 | 10-K | Feb 23, 2026 | $1.5B | +6% | 19.3% | $182M | — |
| Q3 2025 | 10-Q | Oct 14, 2025 | $1.1B | +6% | 19.5% | $139M | $185M |
| Q2 2025 | 10-Q | Jul 21, 2025 | $1.1B | +4% | 19.7% | $131M | — |
| Q1 2025 | 10-Q | Apr 28, 2025 | $1.1B | +2% | 18.9% | $150M | $179M |
Charts
Interactive views
The same charts as the app — open one to draw it.
💵Where each $1 goesinteractive
Loading the interactive chart…
🌏Named in Asian annual reportsinteractive
Loading the interactive chart…
🔄Rotation against the market and its industry (RRG)interactive
Loading the interactive chart…
🔍Earnings qualityinteractive
Loading the interactive chart…
⚖️Fair value by methodinteractive
Loading the interactive chart…
🔭Outlook & guidanceinteractive
Loading the interactive chart…
📈Investments: gains and what it boughtinteractive
Loading the interactive chart…
🏭Its industry’s money flow (input-output)interactive
Loading the interactive chart…
About Dominos Pizza
Domino’s is the largest pizza company in the world with more than 22,100 locations in over 90 markets around the world as of December 28, 2025, and operates two distinct service models within its stores, with a significant business in both delivery and carryout. We are a highly recognized global brand, and we focus on value while serving neighborhoods locally through our large worldwide network of franchise owners and U.S. Company-owned stores through both the delivery and carryout service models. We have been selling quality, affordable food to our customers since 1960. We became “Domino’s Pizza” in 1965 and opened our first franchised store in 1967. Over the past 65 years, we have built Domino’s into one of the most widely-recognized consumer brands in the world.
In its own words, from its 10-K, filed Feb 23, 2026.
Dominos Pizza against its Wholesale-Groceries & Related Products peers
The largest companies of the same SEC industry, each at its latest quarter. Revenue growth: +3% against the peers' median +3%. Operating margin: 20.4% against the peers' median 3.6%.
| Company | Quarter | Revenue | Y/Y | Op. margin |
|---|---|---|---|---|
| DPZ Dominos Pizza | Q3 2026 | $1.2B | +3% | 20.4% |
| SYY Sysco | Q1 FY27 | $21.7B | +3% | 3.3% |
| USFD US Foods Holding | Q3 2026 | $10.4B | +2% | 3.6% |
| HFFG HF Foods Group | Q2 2026 | $324M | +3% | 0.9% |
| RAVE Rave Restaurant Group | Q4 FY26 | $3.4M | +9% | 29.8% |
Source: Dominos Pizza 10-Q on SEC EDGAR · CIK 1286681 · Wholesale-Groceries & Related Products
Guidance and outlook
13F: who owns DPZ and who is buying
More on DPZ
- How Dominos Pizza makes money: revenue by segment
- Dominos Pizza stock forecast, price target and fair value
- Who owns Dominos Pizza stock: holders, funds and Congress trades
- Dominos Pizza guidance and outlook
- Is Dominos Pizza a takeover target? LBO and rumors
- Dominos Pizza recalls, complaints and regulation
History
Every quarter: Q3 2026 results · Q2 2026 results · Q1 2026 results · Q4 2025 results · Q3 2025 results · Q2 2025 results · Q1 2025 results