Filing Flows › Other › EVgo (EVGO)
EVgo (EVGO) earnings and revenue breakdown
Latest: Q2 2026 · 10-Q filed Aug 6, 2026 · EVgo (EVGO) Q2 2026 earnings results →
Q2 2026 Revenue down 16% year over year to $82.6M · 56¢ of every $1 of revenue lost · operating margin -48.6%
EVgo made $82.6M in Q2 2026 (-16% Y/Y): Total charging network $61.4M, Total non-charging network $21.2M. Operating margin -48.6%, net loss $46.3M. See where every dollar goes — costs, profit and cash — as a Sankey from the 10-Q filed Aug 6, 2026.
Drawing the Sankey…
Open the interactive Sankey → click any line for what the company wrote about it, compare Y/Y and Q/Q, export as PNG or PDF
What changed this quarter
Revenue was $82.6M in Q2 2026, down 16% year over year and down 25% from the previous quarter. Charging, retail was the largest line at 46% of revenue. eXtend lost $19.4M year over year (down 52%), 126% of the total change.
Gross margin was 8.9%, down 5.3 points from Q2 2025. Operating costs exceeded revenue by $40.1M, an operating margin of -48.6%. Operating expenses grew 6% against a revenue fall of 16%. The quarter ended with a net loss of $46.3M, wider than the previous quarter's $37.0M loss. Minority interests bore $25.6M of it: to shareholders the quarter was a loss of $20.8M.
Operating cash flow was −$6.5M. Non-cash charges added back $22.0M of depreciation and amortization and $3.3M of share-based compensation. Working capital and other items added $14.6M. Capital expenditures of $33.8M exceeded it, leaving free cash flow of −$40.3M.
Quarterly history
| Quarter | Form | Filed | Revenue | Y/Y | Op. margin | Net earnings | Op. cash flow |
|---|---|---|---|---|---|---|---|
| Q2 2026 | 10-Q | Aug 6, 2026 | $82.6M | -16% | -48.6% | −$46.3M | −$6.5M |
| Q1 2026 | 10-Q | May 5, 2026 | $110M | +46% | -33.2% | −$37.0M | −$35.4M |
| Q4 2025 | 10-K | Mar 9, 2026 | $118M | +76% | -10.4% | −$11.0M | $11.3M |
| Q3 2025 | 10-Q | Nov 10, 2025 | $92.3M | +37% | -36.9% | −$28.4M | −$22.8M |
| Q2 2025 | 10-Q | Aug 5, 2025 | $98.0M | +47% | -31.4% | −$29.8M | $14.1M |
| Q1 2025 | 10-Q | May 6, 2025 | $75.3M | +36% | -44.4% | −$26.2M | −$10.2M |
| Q4 2024 | 10-K | Mar 6, 2025 | $67.5M | +35% | -51.9% | −$35.6M | −$12.8M |
Charts
In supply chains and themes
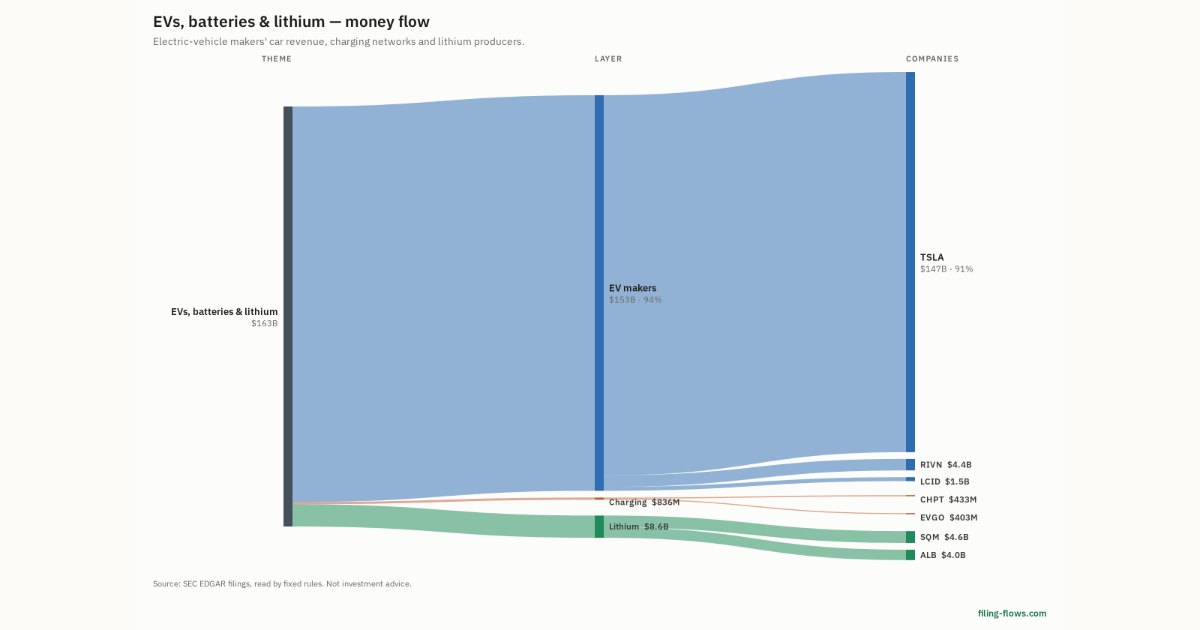
Interactive views
The same charts as the app — open one to draw it.
💵Where each $1 goesinteractive
Loading the interactive chart…
🌏Named in Asian annual reportsinteractive
Loading the interactive chart…
🔄Rotation against the market and its industry (RRG)interactive
Loading the interactive chart…
🔍Earnings qualityinteractive
Loading the interactive chart…
⚖️Fair value by methodinteractive
Loading the interactive chart…
🔭Outlook & guidanceinteractive
Loading the interactive chart…
📈Investments: gains and what it boughtinteractive
Loading the interactive chart…
🏭Its industry’s money flow (input-output)interactive
Loading the interactive chart…
About EVgo
We are one of the nation’s leading public EV fast charging providers. With more than 1,200 fast charging stations across 47 states, we strategically deploy localized and accessible charging infrastructure by partnering with leading businesses across the U.S., including retailers, grocery stores, restaurants, shopping centers, gas stations, rideshare operators and autonomous vehicle companies. The foundation of our business is building, owning and operating EV fast charging sites that deliver charging to EVs driven by individuals, commercial drivers and fleet operators. We prioritize the build out of high-power chargers, a key market segment that is expected to grow faster than the overall EV charging market.
In its own words, from its 10-K, filed Mar 9, 2026.
EVgo against its Services-Automotive Repair, Services & Parking peers
The largest companies of the same SEC industry, each at its latest quarter. Revenue growth: -16% against the peers' median -2%. Operating margin: -48.6% against the peers' median 0.9%.
| Company | Quarter | Revenue | Y/Y | Op. margin |
|---|---|---|---|---|
| EVGO EVgo | Q2 2026 | $82.6M | -16% | -48.6% |
| DRVN Driven Brands Holdings | Q2 2026 | $507M | +7% | 14.4% |
| MNRO Monro | Q2 FY27 | $284M | -2% | 0.9% |
| PNYG Pony Group | Q2 2026 | $31K | -29% | -161.6% |
Source: EVgo 10-Q on SEC EDGAR · CIK 1821159 · Services-Automotive Repair, Services & Parking
13F: who owns EVGO and who is buying
More on EVGO
History
Every quarter: Q2 2026 results · Q1 2026 results · Q4 2025 results · Q3 2025 results · Q2 2025 results · Q1 2025 results · Q4 2024 results