Filing Flows › Materials › Corning (GLW)
Corning (GLW) earnings and revenue breakdown
Latest: Q3 2026 · 10-Q filed Oct 29, 2026 · Corning (GLW) Q3 2026 earnings results →
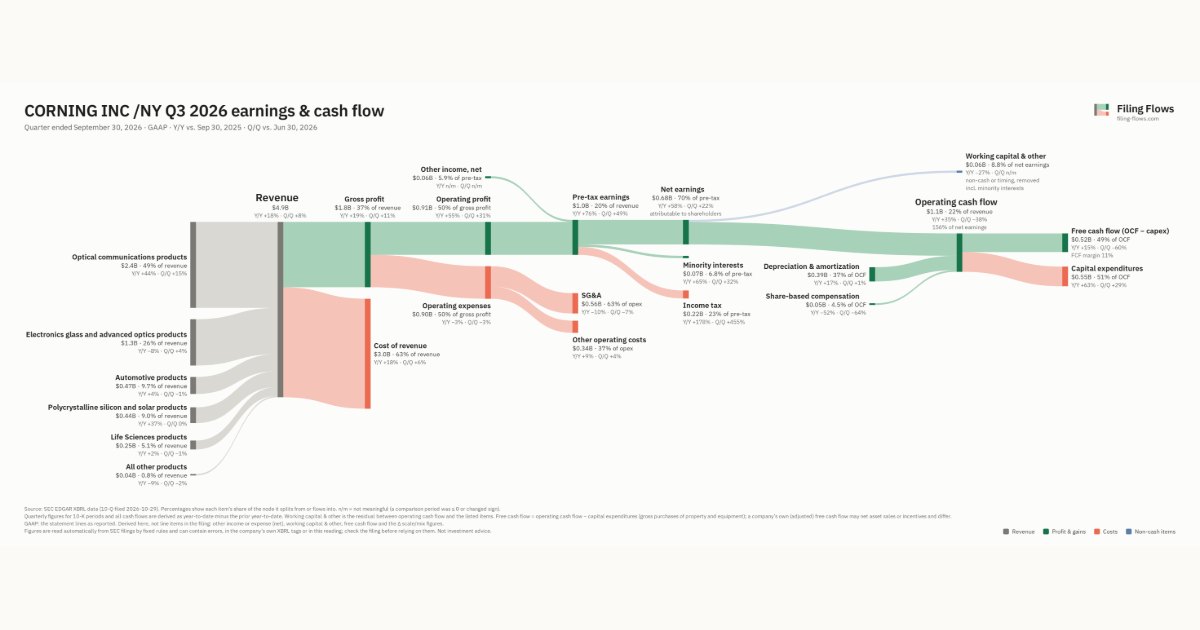
Q3 2026 Revenue up 18% year over year to $4.9B · 14¢ of every $1 of revenue kept as net profit · operating margin 18.8%
Corning made $4.9B in Q3 2026 (+18% Y/Y): Optical communications products $2.4B, Electronics glass and advanced optics products $1.3B, Automotive products $471M. Operating margin 18.8%, net earnings $680M. See where every dollar goes — costs, profit and cash — as a Sankey from the 10-Q filed Oct 29, 2026.
Drawing the Sankey…
Open the interactive Sankey → click any line for what the company wrote about it, compare Y/Y and Q/Q, export as PNG or PDF
What changed this quarter
Revenue was $4.9B in Q3 2026, up 18% year over year and up 8% from the previous quarter. Optical communications products was the largest line at 49% of revenue. Optical communications products added $0.73B year over year (up 44%), 96% of the total change. All other products declined 9%.
Gross margin was 37.3%, up 0.2 points from Q3 2025. Operating profit was $0.91B, a 18.8% margin (up 4.4 points year over year). Of the extra revenue versus Q3 2025, 43% reached operating profit, above the 14% margin then. Operating expenses fell 3% while revenue rose 18%. Net earnings were $0.68B, up 58% year over year. The effective tax rate was 22.9%.
Operating cash flow was $1.1B (up 35% year over year), 142% of net income including minority interests. Non-cash charges added back $0.39B of depreciation and amortization and $0.05B of share-based compensation. Working capital and other items used $0.13B. Capital expenditures of $0.55B left free cash flow of $0.52B.
Quarterly history
| Quarter | Form | Filed | Revenue | Y/Y | Op. margin | Net earnings | Op. cash flow |
|---|---|---|---|---|---|---|---|
| Q3 2026 | 10-Q | Oct 29, 2026 | $4.9B | +18% | 18.8% | $680M | $1.1B |
| Q2 2026 | 10-Q | Jul 29, 2026 | $4.5B | +17% | 15.5% | $559M | $1.7B |
| Q1 2026 | 10-Q | May 1, 2026 | $4.1B | +20% | 15.4% | $371M | $362M |
| Q4 2025 | 10-K | Feb 12, 2026 | $4.2B | +20% | 15.9% | $540M | $1.1B |
| Q3 2025 | 10-Q | Oct 31, 2025 | $4.1B | +21% | 14.4% | $430M | $784M |
| Q2 2025 | 10-Q | Aug 1, 2025 | $3.9B | +19% | 14.8% | $469M | $708M |
| Q1 2025 | 10-Q | May 2, 2025 | $3.5B | +16% | 12.9% | $157M | $151M |
Charts
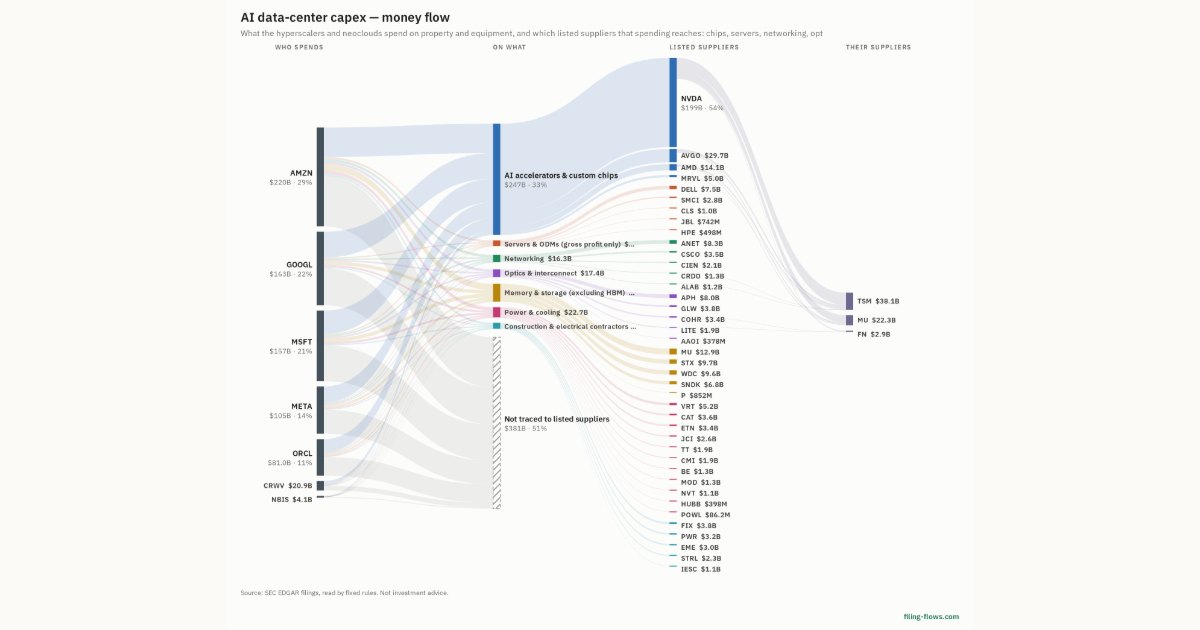
In supply chains and themes
Interactive views
The same charts as the app — open one to draw it.
💵Where each $1 goesinteractive
Loading the interactive chart…
🌏Named in Asian annual reportsinteractive
Loading the interactive chart…
🔄Rotation against the market and its industry (RRG)interactive
Loading the interactive chart…
🔍Earnings qualityinteractive
Loading the interactive chart…
⚖️Fair value by methodinteractive
Loading the interactive chart…
🔭Outlook & guidanceinteractive
Loading the interactive chart…
📈Investments: gains and what it boughtinteractive
Loading the interactive chart…
🏭Its industry’s money flow (input-output)interactive
Loading the interactive chart…
About Corning
Corning traces its origins to a glass business established in 1851. The present corporation was incorporated in the State of New York in December 1936. The Company’s name was changed from Corning Glass Works to Corning Incorporated on April 28, 1989. Corning is vital to progress – in the industries we help advance and in the world we share. With a 175-year track record of life-changing inventions, Corning applies its unparalleled expertise in glass science, ceramic science and optical physics, along with its deep manufacturing and engineering capabilities to develop category-defining products that transform industries and enhance people’s lives. Our materials science and manufacturing expertise, boundless curiosity and commitment to purposeful invention place us at the center of the way the world works, learns and lives.
In its own words, from its 10-K, filed Feb 12, 2026.
Corning against its Drawing & Insulating of Nonferrous Wire peers
The largest companies of the same SEC industry, each at its latest quarter. Revenue growth: +18% against the peers' median +22%. Operating margin: 18.8% against the peers' median 8.7%.
| Company | Quarter | Revenue | Y/Y | Op. margin |
|---|---|---|---|---|
| GLW Corning | Q3 2026 | $4.9B | +18% | 18.8% |
| BDC Belden | Q3 2026 | $966M | +38% | 1.7% |
| OCC Optical Cable | Q3 FY26 | $24.3M | +22% | 8.7% |
Source: Corning 10-Q on SEC EDGAR · CIK 24741 · Drawing & Insulating of Nonferrous Wire
Guidance and outlook
13F: who owns GLW and who is buying
More on GLW
History
Every quarter: Q3 2026 results · Q2 2026 results · Q1 2026 results · Q4 2025 results · Q3 2025 results · Q2 2025 results · Q1 2025 results
- Corning guidance history: guided vs reported
- Corning gross margin by quarter
- Corning operating margin by quarter
- Corning net income by quarter
- Corning free cash flow by quarter
- Corning capital expenditures by quarter
- Corning Optical communications products revenue by quarter
- Corning Electronics glass and advanced optics products revenue by quarter
- Corning Automotive products revenue by quarter