Filing Flows › Materials › Hecla Mining (HL)
Hecla Mining (HL) earnings and revenue breakdown
Latest: Q3 2026 · 10-Q filed Nov 4, 2026 · Hecla Mining (HL) Q3 2026 earnings results →
Q3 2026 Revenue up 25% year over year to $395M · 38¢ of every $1 of revenue kept as net profit · operating margin 39.8%
Hecla Mining made $395M in Q3 2026 (+25% Y/Y): Metal Sales $372M, Environmental Remediation Services $22.4M. Operating margin 39.8%, net earnings $150M. See where every dollar goes — costs, profit and cash — as a Sankey from the 10-Q filed Nov 4, 2026.
Drawing the Sankey…
Open the interactive Sankey → click any line for what the company wrote about it, compare Y/Y and Q/Q, export as PNG or PDF
What changed this quarter
Revenue was $394.8M in Q3 2026, up 25% year over year and up 18% from the previous quarter. Metal Sales was the largest line at 94% of revenue. Metal Sales added $72.6M year over year (up 24%), 92% of the total change.
Gross margin was 50.7%, up 5.6 points from Q3 2025. Operating profit was $157.2M, a 39.8% margin (up 4.7 points year over year). Of the extra revenue versus Q3 2025, 59% reached operating profit, above the 35% margin then. Operating expenses grew 37% against revenue growth of 25%. The fastest-growing cost line was Other operating costs (+56%). Net earnings were $149.6M, up 49% year over year. The effective tax rate was 21.3%.
Operating cash flow was $203.0M (up 37% year over year), 136% of net earnings. Non-cash charges added back $39.2M of depreciation and amortization and $3.4M of share-based compensation. Working capital and other items added $10.7M. Capital expenditures of $51.7M left free cash flow of $151.2M.
Quarterly history
| Quarter | Form | Filed | Revenue | Y/Y | Op. margin | Net earnings | Op. cash flow |
|---|---|---|---|---|---|---|---|
| Q3 2026 | 10-Q | Nov 4, 2026 | $395M | +25% | 39.8% | $150M | $203M |
| Q2 2026 | 10-Q | Aug 4, 2026 | $334M | +52% | 43.6% | $118M | $175M |
| Q1 2026 | 10-Q | May 5, 2026 | $411M | +100% | 54.2% | −$19.0M | $194M |
| Q4 2025 | 10-K | Feb 17, 2026 | $448M | +80% | 49.1% | $134M | $217M |
| Q3 2025 | 10-Q | Nov 5, 2025 | $410M | +67% | 36.3% | $101M | $148M |
| Q2 2025 | 10-Q | Aug 6, 2025 | $304M | +24% | 30.8% | $57.7M | $162M |
| Q1 2025 | 10-Q | May 1, 2025 | $261M | +38% | 20.0% | $28.9M | $35.7M |
Charts
In supply chains and themes
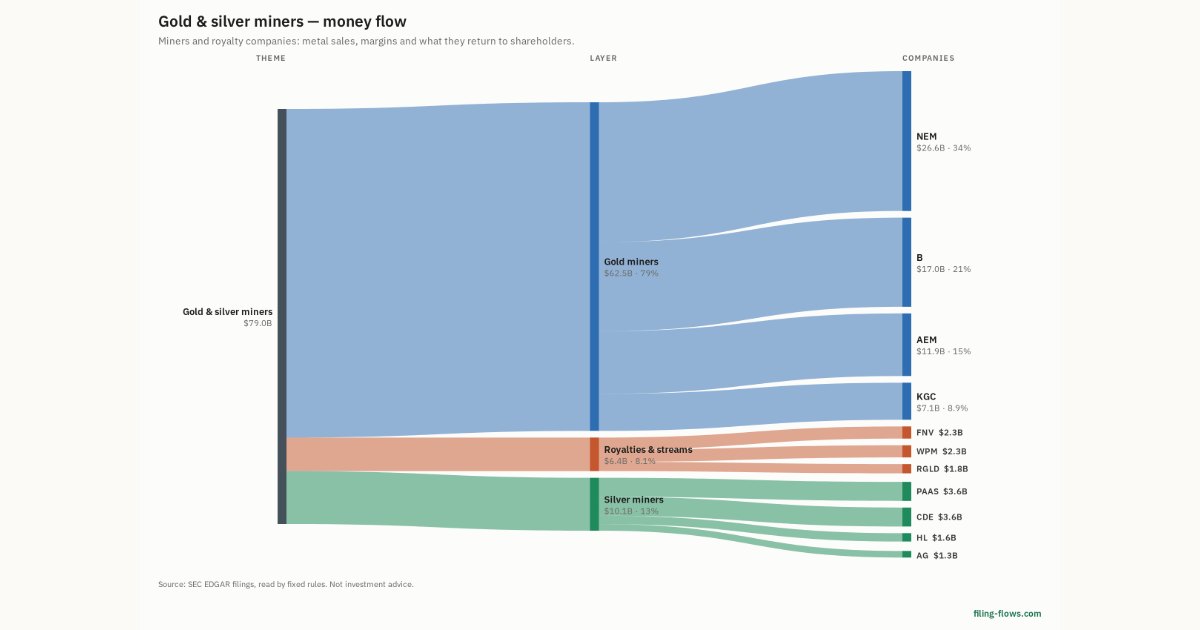
Interactive views
The same charts as the app — open one to draw it.
💵Where each $1 goesinteractive
Loading the interactive chart…
🌏Named in Asian annual reportsinteractive
Loading the interactive chart…
🔄Rotation against the market and its industry (RRG)interactive
Loading the interactive chart…
🔍Earnings qualityinteractive
Loading the interactive chart…
⚖️Fair value by methodinteractive
Loading the interactive chart…
🔭Outlook & guidanceinteractive
Loading the interactive chart…
📈Investments: gains and what it boughtinteractive
Loading the interactive chart…
🏭Its industry’s money flow (input-output)interactive
Loading the interactive chart…
About Hecla Mining
For information regarding the organization of our business segments and our significant customers, see Note 4 of Notes to Consolidated Financial Statements. Hecla Mining Company and its subsidiaries have provided precious and base metals to the U.S. and the world since 1891 (in this report, “we” or “our” or “us” refers to Hecla Mining Company and our affiliates and subsidiaries, unless the context requires otherwise). We discover, acquire and develop mines and other mineral interests and produce and market (i) concentrates containing silver, gold, lead, zinc and copper, (ii) carbon material containing silver and gold, and (iii) unrefined doré containing silver and gold. In doing so, we intend to manage our business activities in a safe, environmentally responsible and cost-effective manner.
In its own words, from its 10-K, filed Feb 17, 2026.
Hecla Mining against its Mining & Quarrying of Nonmetallic Minerals (No Fuels) peers
The largest companies of the same SEC industry, each at its latest quarter. Revenue growth: +25% against the peers' median +4%. Operating margin: 39.8% against the peers' median 16.8%.
| Company | Quarter | Revenue | Y/Y | Op. margin |
|---|---|---|---|---|
| HL Hecla Mining | Q3 2026 | $395M | +25% | 39.8% |
| MLM Martin Marietta Materials | Q3 2026 | $2.4B | +28% | 18.5% |
| VMC Vulcan Materials | Q3 2026 | $2.2B | -5% | 24.0% |
| KNF Knife River | Q3 2026 | $1.3B | +6% | 16.8% |
| CMP Compass Minerals International | Q3 FY26 | $215M | +0.3% | 5.1% |
| SND Smart Sand | Q2 2026 | $115M | +34% | 8.7% |
| USLM United States Lime & Minerals | Q3 2026 | $106M | +4% | 42.1% |
| LEU Centrus Energy | Q3 2026 | $55.5M | -26% | -53.5% |
| IPI Intrepid Potash | Q3 2026 | $51.0M | +0.4% | 0.4% |
Source: Hecla Mining 10-Q on SEC EDGAR · CIK 719413 · Mining & Quarrying of Nonmetallic Minerals (No Fuels)
Guidance and outlook
13F: who owns HL and who is buying
More on HL
- How Hecla Mining makes money: revenue by segment
- Hecla Mining next earnings date and what analysts expect
- Hecla Mining stock forecast, price target and fair value
- Who owns Hecla Mining stock: holders, funds and Congress trades
- Hecla Mining guidance and outlook
- Is Hecla Mining a takeover target? LBO and rumors
- Hecla Mining recalls, complaints and regulation
History
Every quarter: Q3 2026 results · Q2 2026 results · Q1 2026 results · Q4 2025 results · Q3 2025 results · Q2 2025 results · Q1 2025 results
- Hecla Mining guidance history: guided vs reported
- Hecla Mining gross margin by quarter
- Hecla Mining operating margin by quarter
- Hecla Mining net income by quarter
- Hecla Mining free cash flow by quarter
- Hecla Mining capital expenditures by quarter
- Hecla Mining Metal Sales revenue by quarter
- Hecla Mining Environmental Remediation Services revenue by quarter