Filing Flows › Health Care › Organon (OGN)
Organon (OGN) earnings and revenue breakdown
Latest: Q3 2026 · 10-Q filed Oct 30, 2026 · Organon (OGN) Q3 2026 earnings results →
Q3 2026 Revenue down 2% year over year to $1.6B · 10¢ of every $1 of revenue kept as net profit · operating margin 16.2%
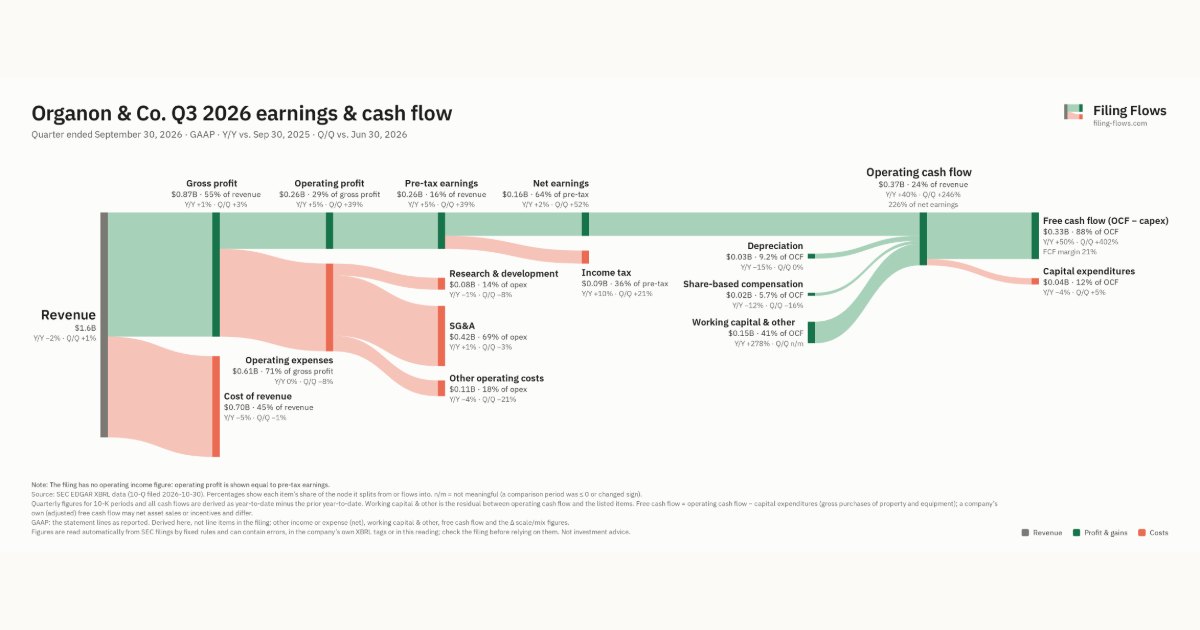
Organon made $1.6B in Q3 2026 (-2% Y/Y). Operating margin 16.2%, net earnings $164M. See where every dollar goes — costs, profit and cash — as a Sankey from the 10-Q filed Oct 30, 2026.
Drawing the Sankey…
Open the interactive Sankey → click any line for what the company wrote about it, compare Y/Y and Q/Q, export as PNG or PDF
What changed this quarter
Revenue was $1.6B in Q3 2026, down 2% year over year and up 1% from the previous quarter.
Gross margin was 55.2%, up 1.7 points from Q3 2025. Operating profit was $0.26B, a 16.2% margin (up 1.0 points year over year). Operating expenses grew 0% against a revenue fall of 2%. Net earnings were $0.16B, up 2% year over year. The effective tax rate was 35.7%.
Operating cash flow was $0.37B (up 40% year over year), 226% of net earnings. Non-cash charges added back $0.03B of depreciation and $0.02B of share-based compensation. Working capital and other items added $0.15B. Capital expenditures of $0.04B left free cash flow of $0.33B.
Quarterly history
| Quarter | Form | Filed | Revenue | Y/Y | Op. margin | Net earnings | Op. cash flow |
|---|---|---|---|---|---|---|---|
| Q3 2026 | 10-Q | Oct 30, 2026 | $1.6B | -2% | 16.2% | $164M | $370M |
| Q2 2026 | 10-Q | Jul 31, 2026 | $1.6B | -2% | 11.7% | $108M | $107M |
| Q1 2026 | 10-Q | May 4, 2026 | $1.5B | -4% | 14.6% | $146M | $225M |
| Q4 2025 | 10-K | Feb 24, 2026 | $1.5B | -5% | -9.8% | −$205M | $141M |
| Q3 2025 | 10-Q | Nov 10, 2025 | $1.6B | +1% | 15.2% | $160M | $264M |
| Q2 2025 | 10-Q | Aug 6, 2025 | $1.6B | -0.8% | 14.4% | $145M | $220M |
| Q1 2025 | 10-Q | May 2, 2025 | $1.5B | -7% | 6.7% | $87.0M | $75.0M |
Charts
Interactive views
The same charts as the app — open one to draw it.
💵Where each $1 goesinteractive
Loading the interactive chart…
🌏Named in Asian annual reportsinteractive
Loading the interactive chart…
🔄Rotation against the market and its industry (RRG)interactive
Loading the interactive chart…
🔍Earnings qualityinteractive
Loading the interactive chart…
⚖️Fair value by methodinteractive
Loading the interactive chart…
🔭Outlook & guidanceinteractive
Loading the interactive chart…
📈Investments: gains and what it boughtinteractive
Loading the interactive chart…
🏭Its industry’s money flow (input-output)interactive
Loading the interactive chart…
Customers and suppliers named in filings
Sells to
About Organon
Organon & Co. (“Organon,” the “Company,” “we,” “our,” or “us”) is a global healthcare company with a mission to deliver impactful medicines and solutions for a healthier every day. With a portfolio of over 70 products across women’s health and general medicines, which includes biosimilars, Organon focuses on addressing health needs that uniquely, disproportionately or differently affect women, while expanding access to essential treatments in over 140 countries and territories. We sell these products through various channels including drug wholesalers and retailers, hospitals, government agencies and managed healthcare providers such as health maintenance organizations, pharmacy benefit managers and other institutions. We operate six manufacturing facilities, which are located in Belgium, Brazil, Indonesia, Mexico, the Netherlands and the United Kingdom (“UK”).
In its own words, from its 10-K, filed Feb 24, 2026.
Organon against its Pharmaceutical Preparations peers
The largest companies of the same SEC industry, each at its latest quarter. Revenue growth: -2% against the peers' median +7%. Operating margin: 16.2% against the peers' median 20.4%.
| Company | Quarter | Revenue | Y/Y | Op. margin |
|---|---|---|---|---|
| OGN Organon | Q3 2026 | $1.6B | -2% | 16.2% |
| JNJ Johnson & Johnson | Q3 2026 | $25.4B | +6% | 0.1% |
| LLY ELI Lilly | Q3 2026 | $24.4B | +39% | 34.5% |
| MRK Merck | Q3 2026 | $18.1B | +5% | 30.7% |
| ABBV AbbVie | Q3 2026 | $17.4B | +10% | 36.0% |
| PFE Pfizer | Q3 2026 | $16.6B | -0.4% | 20.4% |
| BMY Bristol Myers Squibb | Q3 2026 | $13.1B | +7% | 19.4% |
| ABT Abbott Laboratories | Q3 2026 | $13.0B | +14% | 10.4% |
| REGN Regeneron Pharmaceuticals | Q3 2026 | $5.1B | +36% | 40.0% |
Source: Organon 10-Q on SEC EDGAR · CIK 1821825 · Pharmaceutical Preparations
Guidance and outlook
13F: who owns OGN and who is buying
More on OGN
History
Every quarter: Q3 2026 results · Q2 2026 results · Q1 2026 results · Q4 2025 results · Q3 2025 results · Q2 2025 results · Q1 2025 results