Filing Flows › Materials › O-I Glass (OI)
O-I Glass (OI) earnings and revenue breakdown
Latest: Q3 2026 · 10-Q filed Oct 28, 2026 · O-I Glass (OI) Q3 2026 earnings results →
Q3 2026 Revenue down 2% year over year to $1.6B · 0¢ of every $1 of revenue lost · operating margin 2.1%
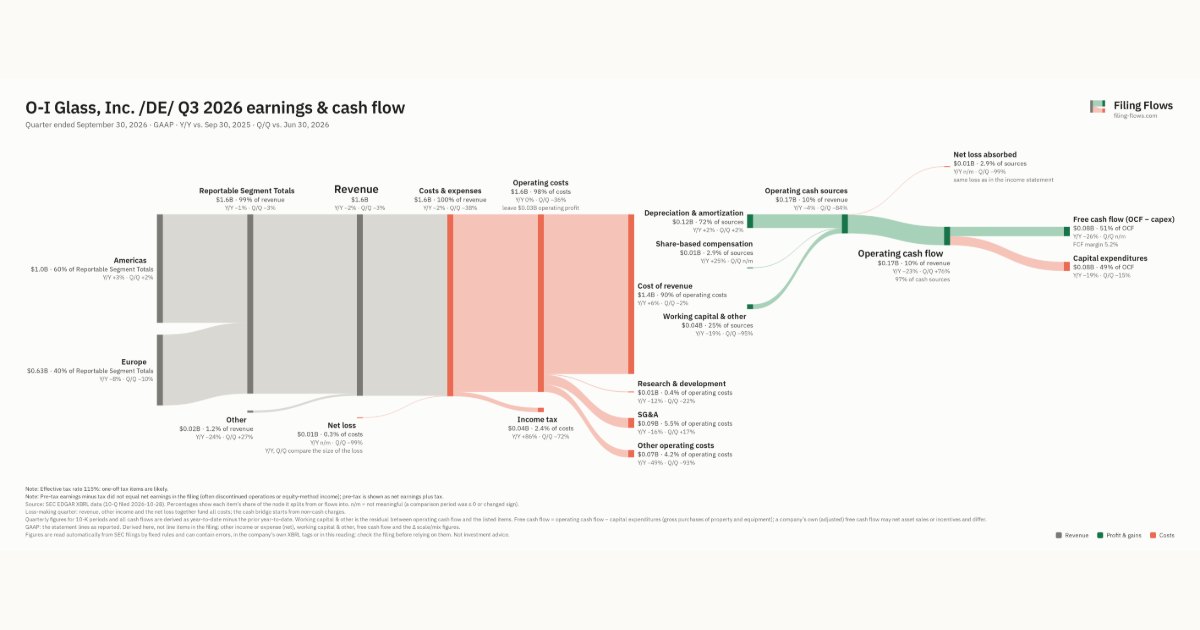
O-I Glass made $1.6B in Q3 2026 (-2% Y/Y): Reportable Segment Totals $1.6B, Other $19.0M. Operating margin 2.1%, net loss $5.0M. See where every dollar goes — costs, profit and cash — as a Sankey from the 10-Q filed Oct 28, 2026.
Drawing the Sankey…
Open the interactive Sankey → click any line for what the company wrote about it, compare Y/Y and Q/Q, export as PNG or PDF
What changed this quarter
Revenue was $1.6B in Q3 2026, down 2% year over year and down 3% from the previous quarter. Americas was the largest line at 60% of revenue. Europe lost $0.05B year over year (down 8%), 180% of the total change.
Gross margin was 12.0%, down 6.1 points from Q3 2025. Operating profit was $0.03B, a 2.1% margin (down 1.4 points year over year). Operating expenses fell 33% while revenue fell 2%. The quarter ended with a net loss of $0.01B, narrower than the previous quarter's $1.0B loss.
Operating cash flow was $0.17B (down 23% year over year). Non-cash charges added back $0.12B of depreciation and amortization and $0.01B of share-based compensation. Working capital and other items added $0.04B. Capital expenditures of $0.08B left free cash flow of $0.08B.
Quarterly history
| Quarter | Form | Filed | Revenue | Y/Y | Op. margin | Net earnings | Op. cash flow |
|---|---|---|---|---|---|---|---|
| Q3 2026 | 10-Q | Oct 28, 2026 | $1.6B | -2% | 2.1% | −$5.0M | $165M |
| Q2 2026 | 10-Q | Jul 29, 2026 | $1.7B | -2% | -49.6% | −$965M | $94.0M |
| Q1 2026 | 10-Q | Apr 29, 2026 | $1.5B | -2% | -3.4% | −$71.0M | −$294M |
| Q4 2025 | 10-K | Feb 12, 2026 | $1.5B | -2% | -8.8% | −$129M | $402M |
| Q3 2025 | 10-Q | Nov 5, 2025 | $1.7B | -2% | 3.5% | $30.0M | $214M |
| Q2 2025 | 10-Q | Jul 30, 2025 | $1.7B | -1% | 0.4% | $1.0M | $155M |
| Q1 2025 | 10-Q | Apr 30, 2025 | $1.6B | -2% | 1.1% | −$12.0M | −$171M |
Charts
Interactive views
The same charts as the app — open one to draw it.
💵Where each $1 goesinteractive
Loading the interactive chart…
🌏Named in Asian annual reportsinteractive
Loading the interactive chart…
🔄Rotation against the market and its industry (RRG)interactive
Loading the interactive chart…
🔍Earnings qualityinteractive
Loading the interactive chart…
⚖️Fair value by methodinteractive
Loading the interactive chart…
🔭Outlook & guidanceinteractive
Loading the interactive chart…
📈Investments: gains and what it boughtinteractive
Loading the interactive chart…
🏭Its industry’s money flow (input-output)interactive
Loading the interactive chart…
About O-I Glass
O-I Glass, Inc., a Delaware corporation (the “Company”), through its subsidiaries, is the successor to a business established in 1903. The Company is one of the leading manufacturers of glass containers in the world with 64 glass manufacturing plants in 18 countries. It competes in the glass container segment of the rigid packaging market and is the leading glass container manufacturer in most of the countries where it has manufacturing facilities. Beginning in 2024, the Company commenced a strategic review of its global profitability and manufacturing footprint, known as its Fit to Win initiative. This program is focused on the reduction of redundant production capacity and the optimization of its network, as well as streamlining other costs, such as selling, general and administrative expenses. The Fit to Win initiative is expected to last at least through 2026.
In its own words, from its 10-K, filed Feb 12, 2026.
Source: O-I Glass 10-Q on SEC EDGAR · CIK 812074 · Glass Containers
13F: who owns OI and who is buying
More on OI
History
Every quarter: Q3 2026 results · Q2 2026 results · Q1 2026 results · Q4 2025 results · Q3 2025 results · Q2 2025 results · Q1 2025 results