Filing Flows › Industrials › Paychex (PAYX)
Paychex (PAYX) earnings and revenue breakdown
Latest: Q1 FY27 · 10-Q filed Sep 24, 2026 · Paychex (PAYX) Q1 FY27 earnings results →
Q1 FY27 Revenue up 6% year over year to $1.6B · 26¢ of every $1 of revenue kept as net profit · operating margin 38.0%
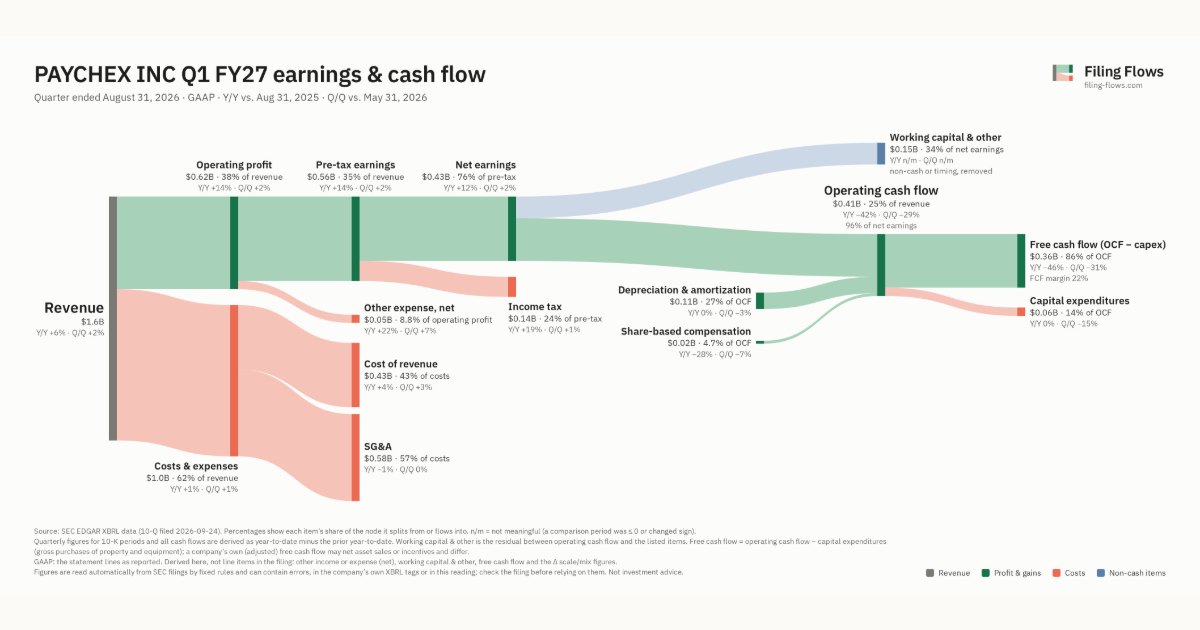
Paychex made $1.6B in Q1 FY27 (+6% Y/Y). Operating margin 38.0%, net earnings $430M. See where every dollar goes — costs, profit and cash — as a Sankey from the 10-Q filed Sep 24, 2026.
Drawing the Sankey…
Open the interactive Sankey → click any line for what the company wrote about it, compare Y/Y and Q/Q, export as PNG or PDF
What changed this quarter
Revenue was $1.6B in Q1 FY27, up 6% year over year and up 2% from the previous quarter.
Operating profit was $0.62B, a 38.0% margin (up 2.8 points year over year). Of the extra revenue versus Q1 FY26, 85% reached operating profit, above the 35% margin then. Total costs grew 1% against revenue growth of 6%. Net earnings were $0.43B, up 12% year over year. The effective tax rate was 23.9%.
Operating cash flow was $0.41B (down 42% year over year), 96% of net earnings. Non-cash charges added back $0.11B of depreciation and amortization and $0.02B of share-based compensation. Working capital and other items used $0.15B. Capital expenditures of $0.06B left free cash flow of $0.36B.
Quarterly history
| Quarter | Form | Filed | Revenue | Y/Y | Op. margin | Net earnings | Op. cash flow |
|---|---|---|---|---|---|---|---|
| Q1 FY27 | 10-Q | Sep 24, 2026 | $1.6B | +6% | 38.0% | $430M | $414M |
| Q4 FY26 | 10-K | Jul 17, 2026 | $1.6B | +12% | 37.7% | $421M | $581M |
| Q3 FY26 | 10-Q | Mar 26, 2026 | $1.8B | +20% | 43.8% | $560M | $812M |
| Q2 FY26 | 10-Q | Dec 22, 2025 | $1.6B | +18% | 36.7% | $395M | $445M |
| Q1 FY26 | 10-Q | Sep 30, 2025 | $1.5B | +17% | 35.2% | $384M | $718M |
| Q4 FY25 | 10-K | Jul 11, 2025 | $1.4B | +10% | 30.2% | $297M | $344M |
| Q3 FY25 | 10-Q | Mar 26, 2025 | $1.5B | +5% | 45.8% | $519M | $716M |
Charts
Interactive views
The same charts as the app — open one to draw it.
💵Where each $1 goesinteractive
Loading the interactive chart…
🌏Named in Asian annual reportsinteractive
Loading the interactive chart…
🔄Rotation against the market and its industry (RRG)interactive
Loading the interactive chart…
🔍Earnings qualityinteractive
Loading the interactive chart…
⚖️Fair value by methodinteractive
Loading the interactive chart…
🔭Outlook & guidanceinteractive
Loading the interactive chart…
📈Investments: gains and what it boughtinteractive
Loading the interactive chart…
🏭Its industry’s money flow (input-output)interactive
Loading the interactive chart…
About Paychex
Unless we state otherwise or the context otherwise requires, the terms “Paychex,” “we,” “us,” “our” and the “Company” refer to Paychex, Inc., a Delaware corporation, and its consolidated subsidiaries. We are an industry-leading human capital management (“HCM”) company delivering a full suite of technology and advisory solutions in human resources (“HR”), employee benefit solutions, insurance, and payroll processing. As of May 31, 2025, we served approximately 800,000 clients and their employees across the U.S. and parts of Europe. Paychex was incorporated in Delaware in 1979, maintains a corporate headquarters in Rochester, New York, and has a fiscal year that ends on May 31st.
In its own words, from its annual report, filed Jul 11, 2025.
Paychex against its Services-Engineering, Accounting, Research, Management peers
The largest companies of the same SEC industry, each at its latest quarter.
| Company | Quarter | Revenue | Y/Y | Op. margin |
|---|---|---|---|---|
| PAYX Paychex | Q1 FY27 | $1.6B | +6% | 38.0% |
| FORR Forrester Research | Q3 2026 | $86.1M | -9% | 2.8% |
Source: Paychex 10-Q on SEC EDGAR · CIK 723531 · Services-Engineering, Accounting, Research, Management
13F: who owns PAYX and who is buying
More on PAYX
History
Every quarter: Q1 FY27 results · Q4 FY26 results · Q3 FY26 results · Q2 FY26 results · Q1 FY26 results · Q4 FY25 results · Q3 FY25 results