Filing Flows › Consumer Discretionary › Starbucks (SBUX)
Starbucks (SBUX) earnings and revenue breakdown
Latest: Q4 FY26 · 8-K filed Oct 29, 2026
Q4 FY26 Revenue down 4% year over year to $9.1B · 7¢ of every $1 of revenue kept as net profit · operating margin 10.8%
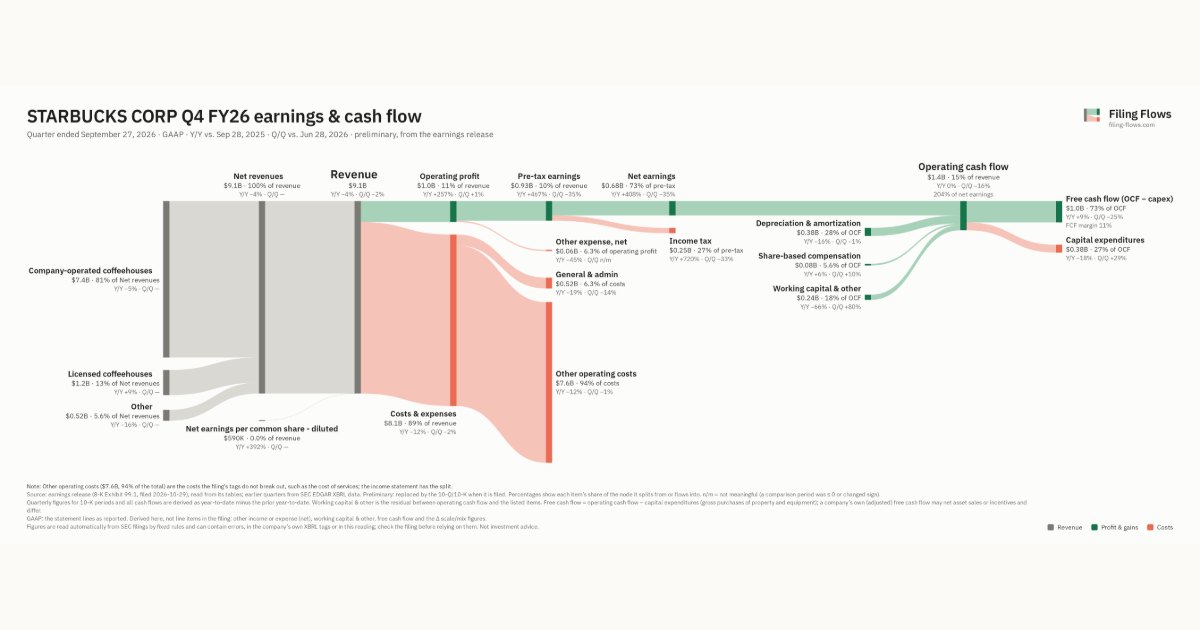
Starbucks made $9.1B in Q4 FY26 (-4% Y/Y): Company-operated coffeehouses $7.4B, Licensed coffeehouses $1.2B, Other $516M. Operating margin 10.8%, net earnings $677M. See where every dollar goes — costs, profit and cash — as a Sankey from the 8-K filed Oct 29, 2026 (preliminary, from the earnings release).
Drawing the Sankey…
Open the interactive Sankey → click any line for what the company wrote about it, compare Y/Y and Q/Q, export as PNG or PDF
What changed this quarter
Revenue was $9.1B in Q4 FY26, down 4% year over year and down 2% from the previous quarter. Company-operated coffeehouses was the largest line at 81% of revenue. Company-operated coffeehouses lost $0.43B year over year (down 5%), 101% of the total change.
Operating profit was $1.0B, a 10.8% margin (up 7.9 points year over year). Total costs fell 12% while revenue fell 4%. Net earnings were $0.68B, up 408% year over year. The effective tax rate was 27.1%.
Operating cash flow was $1.4B (roughly flat year over year), 204% of net earnings. Non-cash charges added back $0.38B of depreciation and amortization and $0.08B of share-based compensation. Working capital and other items added $0.24B. Capital expenditures of $0.38B left free cash flow of $1.0B.
Quarterly history
| Quarter | Form | Filed | Revenue | Y/Y | Op. margin | Net earnings | Op. cash flow |
|---|---|---|---|---|---|---|---|
| Q4 FY26 | 8-K | Oct 29, 2026 | $9.1B | -4% | 10.8% | $677M | $1.4B |
| Q3 FY26 | 10-Q | Jul 29, 2026 | $9.3B | -1% | 10.5% | $1.0B | $1.6B |
| Q2 FY26 | 10-Q | Apr 28, 2026 | $9.5B | +9% | 8.7% | $511M | $364M |
| Q1 FY26 | 10-Q | Jan 28, 2026 | $9.9B | +6% | 9.0% | $293M | $1.6B |
| Q4 FY25 | 10-K | Nov 14, 2025 | $9.6B | +6% | 2.9% | $133M | $1.4B |
| Q3 FY25 | 10-Q | Jul 29, 2025 | $9.5B | +4% | 9.9% | $558M | $1.0B |
| Q2 FY25 | 10-Q | Apr 29, 2025 | $8.8B | +2% | 6.9% | $384M | $292M |
Charts
Interactive views
The same charts as the app — open one to draw it.
💵Where each $1 goesinteractive
Loading the interactive chart…
🌏Named in Asian annual reportsinteractive
Loading the interactive chart…
🔄Rotation against the market and its industry (RRG)interactive
Loading the interactive chart…
🔍Earnings qualityinteractive
Loading the interactive chart…
⚖️Fair value by methodinteractive
Loading the interactive chart…
🔭Outlook & guidanceinteractive
Loading the interactive chart…
📈Investments: gains and what it boughtinteractive
Loading the interactive chart…
🏭Its industry’s money flow (input-output)interactive
Loading the interactive chart…
About Starbucks
In this Annual Report on Form 10-K (“10-K” or “Report”) for the fiscal year ended September 28, 2025 (“fiscal 2025”), Starbucks Corporation (together with its subsidiaries) is referred to as “Starbucks,” the “Company,” “we,” “us,” or “our.” Starbucks is the premier roaster, marketer, and retailer of specialty coffee in the world, operating in 89 markets. Formed in 1985, Starbucks Corporation’s common stock trades on the Nasdaq Global Select Market (“Nasdaq”) under the symbol “SBUX.” We purchase and roast high-quality coffees that we sell, along with handcrafted coffee, tea, and other beverages and a variety of high-quality food items through company-operated stores (“stores” or “coffeehouses”).
In its own words, from its 10-K, filed Nov 14, 2025.
Starbucks against its Retail-Eating & Drinking Places peers
The largest companies of the same SEC industry, each at its latest quarter. Revenue growth: -4% against the peers' median +15%. Operating margin: 10.8% against the peers' median 6.5%.
| Company | Quarter | Revenue | Y/Y | Op. margin |
|---|---|---|---|---|
| SBUX Starbucks | Q4 FY26 | $9.1B | -4% | 10.8% |
| BROS Dutch Bros | Q3 2026 | $550M | +30% | 9.6% |
| WEN Wendy's | Q3 2026 | $547M | -0.5% | 10.2% |
| SHAK Shake Shack | Q3 2026 | $423M | +15% | 5.1% |
| SDOT Sadot Group | Q2 2025 | $114M | — | 1.5% |
| CNNE Cannae Holdings | Q2 2026 | $102M | -7% | -55.6% |
| BRCB Black Rock Coffee Bar | Q2 2026 | $63.0M | +25% | 6.5% |
Source: Starbucks 8-K on SEC EDGAR · CIK 829224 · Retail-Eating & Drinking Places
Guidance and outlook
13F: who owns SBUX and who is buying
More on SBUX
History
Every quarter: Q4 FY26 results · Q3 FY26 results · Q2 FY26 results · Q1 FY26 results · Q4 FY25 results · Q3 FY25 results · Q2 FY25 results