Filing Flows › Industrials › Thermo Fisher Scientific (TMO)
Thermo Fisher Scientific (TMO) earnings and revenue breakdown
Latest: Q3 2026 · 10-Q filed Oct 30, 2026 · Thermo Fisher Scientific (TMO) Q3 2026 earnings results →
Q3 2026 Revenue up 9% year over year to $12.1B · 14¢ of every $1 of revenue kept as net profit · operating margin 18.6%
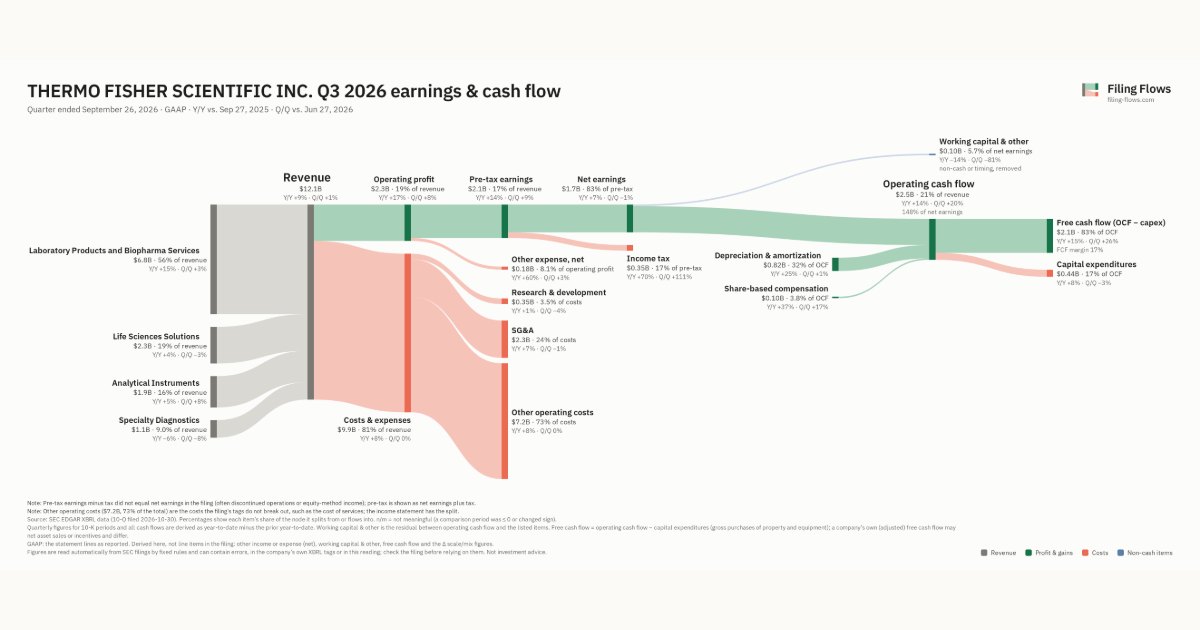
Thermo Fisher Scientific made $12.1B in Q3 2026 (+9% Y/Y): Laboratory Products and Biopharma Services $6.8B, Life Sciences Solutions $2.3B, Analytical Instruments $1.9B. Operating margin 18.6%, net earnings $1.7B. See where every dollar goes — costs, profit and cash — as a Sankey from the 10-Q filed Oct 30, 2026.
Drawing the Sankey…
Open the interactive Sankey → click any line for what the company wrote about it, compare Y/Y and Q/Q, export as PNG or PDF
What changed this quarter
Revenue was $12.1B in Q3 2026, up 9% year over year and up 1% from the previous quarter. Laboratory Products and Biopharma Services was the largest line at 56% of revenue. Laboratory Products and Biopharma Services added $0.89B year over year (up 15%), 88% of the total change. Specialty Diagnostics declined 6%.
Operating profit was $2.3B, a 18.6% margin (up 1.2 points year over year). Of the extra revenue versus Q3 2025, 32% reached operating profit, above the 17% margin then. Total costs grew 8% against revenue growth of 9%. Net earnings were $1.7B, up 6% year over year. The effective tax rate was 16.9%.
Operating cash flow was $2.5B (up 14% year over year), 148% of net earnings. Non-cash charges added back $0.82B of depreciation and amortization and $0.10B of share-based compensation. Capital expenditures of $0.44B left free cash flow of $2.1B.
Quarterly history
| Quarter | Form | Filed | Revenue | Y/Y | Op. margin | Net earnings | Op. cash flow |
|---|---|---|---|---|---|---|---|
| Q3 2026 | 10-Q | Oct 30, 2026 | $12.1B | +9% | 18.6% | $1.7B | $2.5B |
| Q2 2026 | 10-Q | Jul 31, 2026 | $12.0B | +10% | 17.4% | $1.7B | $2.1B |
| Q1 2026 | 10-Q | May 1, 2026 | $11.0B | +6% | 16.9% | $1.7B | $1.2B |
| Q4 2025 | 10-K | Feb 26, 2026 | $12.2B | +7% | 18.5% | $2.0B | $3.5B |
| Q3 2025 | 10-Q | Oct 31, 2025 | $11.1B | +5% | 17.5% | $1.6B | $2.2B |
| Q2 2025 | 10-Q | Aug 1, 2025 | $10.9B | +3% | 16.9% | $1.6B | $1.4B |
| Q1 2025 | 10-Q | May 2, 2025 | $10.4B | +0.2% | 16.6% | $1.5B | $723M |
Charts
In supply chains and themes
Interactive views
The same charts as the app — open one to draw it.
💵Where each $1 goesinteractive
Loading the interactive chart…
🌏Named in Asian annual reportsinteractive
Loading the interactive chart…
🔄Rotation against the market and its industry (RRG)interactive
Loading the interactive chart…
🔍Earnings qualityinteractive
Loading the interactive chart…
⚖️Fair value by methodinteractive
Loading the interactive chart…
🔭Outlook & guidanceinteractive
Loading the interactive chart…
📈Investments: gains and what it boughtinteractive
Loading the interactive chart…
🏭Its industry’s money flow (input-output)interactive
Loading the interactive chart…
Customers and suppliers named in filings
Sells to
- IDXX · Stated in 10-K (named, share not stated) · source
- CDNA · Stated in 10-K (named, share not stated) · source
- DNA · Stated in 10-K (named, share not stated) · source
About Thermo Fisher Scientific
Thermo Fisher Scientific Inc. (also referred to in this document as “Thermo Fisher,” “we,” the “company,” or the “registrant”) is the world leader in serving science. Our Mission is to enable our customers to make the world healthier, cleaner and safer. We serve customers working in pharmaceutical and biotech companies, hospitals and clinical diagnostic labs, universities, research institutions and government agencies, as well as environmental, industrial, research and development, quality and process control settings. Our global team delivers an unrivaled combination of innovative technologies, purchasing convenience and pharmaceutical services through our industry-leading brands, including Thermo Scientific, Applied Biosystems, Invitrogen, Fisher Scientific, Unity Lab Services, Patheon and PPD.
In its own words, from its 10-K, filed Feb 26, 2026.
Thermo Fisher Scientific against its Measuring & Controlling Devices, NEC peers
The largest companies of the same SEC industry, each at its latest quarter. Revenue growth: +9% against the peers' median +9%. Operating margin: 18.6% against the peers' median 6.2%.
| Company | Quarter | Revenue | Y/Y | Op. margin |
|---|---|---|---|---|
| TMO Thermo Fisher Scientific | Q3 2026 | $12.1B | +9% | 18.6% |
| ROK Rockwell Automation | Q4 FY26 | $2.3B | +0.7% | 18.6% |
| TRMB Trimble | Q3 2026 | $967M | +7% | 14.7% |
| ONTO Onto Innovation | Q2 2026 | $343M | +35% | 18.5% |
| MIR Mirion Technologies | Q3 2026 | $278M | +24% | 6.2% |
| OWLT Owlet | Q2 2026 | $33.9M | +30% | 5.1% |
| GEOS Geospace Technologies | Q3 FY26 | $15.8M | -36% | -64.1% |
| BCHT Birchtech | Q2 2026 | $3.8M | +16% | -42.8% |
| US Nuclear | Q1 2026 | $352K | -26% | -41.4% |
Source: Thermo Fisher Scientific 10-Q on SEC EDGAR · CIK 97745 · Measuring & Controlling Devices, NEC
Guidance and outlook
13F: who owns TMO and who is buying
More on TMO
- How Thermo Fisher Scientific makes money: revenue by segment
- Thermo Fisher Scientific stock forecast, price target and fair value
- Who owns Thermo Fisher Scientific stock: holders, funds and Congress trades
- Thermo Fisher Scientific guidance and outlook
- Is Thermo Fisher Scientific a takeover target? LBO and rumors
- Thermo Fisher Scientific recalls, complaints and regulation
History
Every quarter: Q3 2026 results · Q2 2026 results · Q1 2026 results · Q4 2025 results · Q3 2025 results · Q2 2025 results · Q1 2025 results
- Thermo Fisher Scientific guidance history: guided vs reported
- Thermo Fisher Scientific operating margin by quarter
- Thermo Fisher Scientific net income by quarter
- Thermo Fisher Scientific free cash flow by quarter
- Thermo Fisher Scientific R&D spending by quarter
- Thermo Fisher Scientific capital expenditures by quarter
- Thermo Fisher Scientific Laboratory Products and Biopharma Services revenue by quarter
- Thermo Fisher Scientific Life Sciences Solutions revenue by quarter
- Thermo Fisher Scientific Analytical Instruments revenue by quarter