Filing Flows › Materials › Uranium Energy (UEC)
Uranium Energy (UEC) earnings and revenue breakdown
Latest: Q4 FY26 · 10-K filed Sep 29, 2026 · Uranium Energy (UEC) Q4 FY26 earnings results →
Q4 FY26 356¢ of every $1 of revenue lost · operating margin -228.6%
Uranium Energy made $17.1M in Q4 FY26. Operating margin -228.6%, net loss $60.7M. See where every dollar goes — costs, profit and cash — as a Sankey from the 10-K filed Sep 29, 2026.
Drawing the Sankey…
Open the interactive Sankey → click any line for what the company wrote about it, compare Y/Y and Q/Q, export as PNG or PDF
What changed this quarter
Revenue was $17.1M in Q4 FY26.
Gross margin was 40.3%. Operating costs exceeded revenue by $39.0M, an operating margin of -228.6%. The quarter ended with a net loss of $60.7M.
Operating cash flow was −$8.5M. Non-cash charges added back $1.9M of depreciation and amortization and $2.0M of share-based compensation. Working capital and other items added $48.3M. Capital expenditures of $3.1M exceeded it, leaving free cash flow of −$11.6M.
Quarterly history
| Quarter | Form | Filed | Revenue | Y/Y | Op. margin | Net earnings | Op. cash flow |
|---|---|---|---|---|---|---|---|
| Q4 FY26 | 10-K | Sep 29, 2026 | $17.1M | — | -228.6% | −$60.7M | −$8.5M |
| Q2 FY26 | 10-Q | Mar 10, 2026 | $20.2M | -59% | -116.6% | −$13.9M | −$38.1M |
| Q2 FY25 | 10-Q | Mar 12, 2025 | $49.8M | 429× | -7.3% | −$10.2M | −$8.8M |
Charts
In supply chains and themes
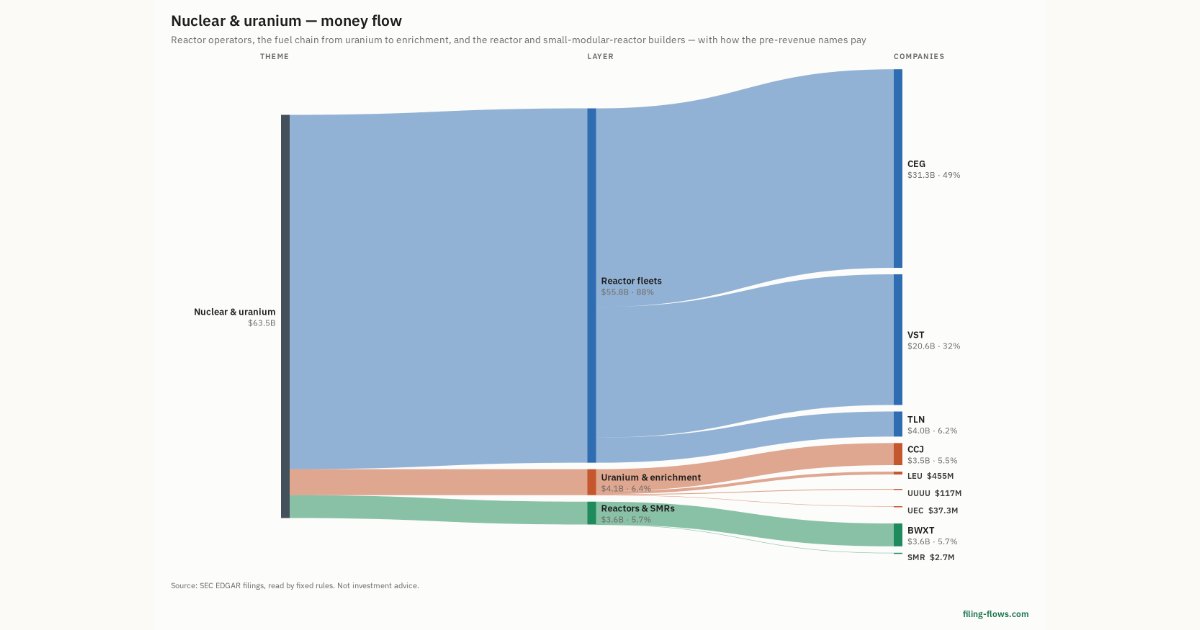
Interactive views
The same charts as the app — open one to draw it.
💵Where each $1 goesinteractive
Loading the interactive chart…
🌏Named in Asian annual reportsinteractive
Loading the interactive chart…
🔄Rotation against the market and its industry (RRG)interactive
Loading the interactive chart…
🔍Earnings qualityinteractive
Loading the interactive chart…
⚖️Fair value by methodinteractive
Loading the interactive chart…
🔭Outlook & guidanceinteractive
Loading the interactive chart…
📈Investments: gains and what it boughtinteractive
Loading the interactive chart…
🏭Its industry’s money flow (input-output)interactive
Loading the interactive chart…
About Uranium Energy
We are a uranium mining and development company. In August 2024, we re-commenced production at our Christensen Ranch ISR project in Wyoming and, in April 2026, we commenced production at our Burke Hollow ISR mine in South Texas. We have three ISR mining “hub and spoke” platforms, one in South Texas and two in Wyoming. We operate out of two of these platforms, anchored by fully licensed and operational uranium central processing plants (“ CPPs ”): our Hobson CPP located in Texas and our Irigaray CPP located in Wyoming. The third platform is anchored by our Sweetwater Mill located in Wyoming, currently configured for conventional mining and undergoing refurbishment to accept production from ISR mines. ISR mining is considered a proven mining method with reduced environmental impacts compared to alternative methods. UEC has several U.S.
In its own words, from its 10-K, filed Sep 29, 2026.
Uranium Energy against its Miscellaneous Metal Ores peers
The largest companies of the same SEC industry, each at its latest quarter. Operating margin: -228.6% against the peers' median -228.6%.
| Company | Quarter | Revenue | Y/Y | Op. margin |
|---|---|---|---|---|
| UEC Uranium Energy | Q4 FY26 | $17.1M | — | -228.6% |
| EU enCore Energy | Q2 2026 | $15.7M | +328% | -187.9% |
| WSTRF Western Uranium & Vanadium | Q2 2026 | $200K | +554% | -608.6% |
Source: Uranium Energy 10-K on SEC EDGAR · CIK 1334933 · Miscellaneous Metal Ores
13F: who owns UEC and who is buying
More on UEC
History
Every quarter: Q4 FY26 results · Q2 FY26 results · Q2 FY25 results