Filing Flows › Consumer Discretionary › Versigent (VGNT)
Versigent (VGNT) earnings and revenue breakdown
Latest: Q3 2026 · 10-Q filed Nov 4, 2026 · Versigent (VGNT) Q3 2026 earnings results →
Q3 2026 Revenue up 7% year over year to $2.5B · 4¢ of every $1 of revenue kept as net profit · operating margin 7.6%
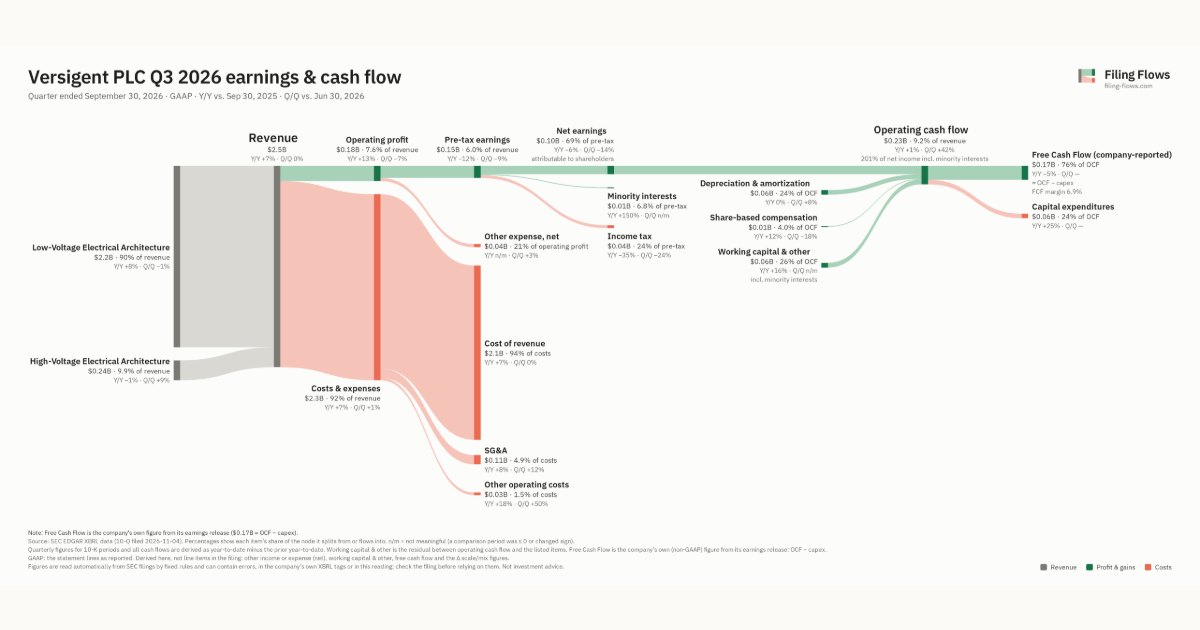
Versigent made $2.5B in Q3 2026 (+7% Y/Y): Low-Voltage Electrical Architecture $2.2B, High-Voltage Electrical Architecture $242M. Operating margin 7.6%, net earnings $102M. See where every dollar goes — costs, profit and cash — as a Sankey from the 10-Q filed Nov 4, 2026.
Drawing the Sankey…
Open the interactive Sankey → click any line for what the company wrote about it, compare Y/Y and Q/Q, export as PNG or PDF
What changed this quarter
Revenue was $2.5B in Q3 2026, up 7% year over year and roughly flat from the previous quarter. Low-Voltage Electrical Architecture was the largest line at 90% of revenue. Low-Voltage Electrical Architecture added $0.17B year over year (up 8%), 102% of the total change. High-Voltage Electrical Architecture declined 1%.
Operating profit was $0.18B, a 7.6% margin (up 0.4 points year over year). Of the extra revenue versus a year earlier, 13% reached operating profit, above the 7% margin then. Total costs grew 7% against revenue growth of 7%. The fastest-growing cost line was Other operating costs (+18%). Net earnings were $0.10B, down 6% year over year. The effective tax rate was 23.8%.
Operating cash flow was $0.23B (up 1% year over year), 201% of net income including minority interests. Non-cash charges added back $0.06B of depreciation and amortization and $0.01B of share-based compensation. Working capital and other items added $0.05B. After capital expenditures ($0.06B), free cash flow as the company reports it was $0.17B.
Quarterly history
| Quarter | Form | Filed | Revenue | Y/Y | Op. margin | Net earnings | Op. cash flow |
|---|---|---|---|---|---|---|---|
| Q3 2026 | 10-Q | Nov 4, 2026 | $2.5B | +7% | 7.6% | $102M | $225M |
| Q2 2026 | 10-Q | Aug 4, 2026 | $2.4B | +11% | 8.1% | $118M | $158M |
| Q1 2026 | 10-Q | May 5, 2026 | $2.2B | +9% | 3.3% | $78.0M | $36.0M |
Charts
Interactive views
The same charts as the app — open one to draw it.
💵Where each $1 goesinteractive
Loading the interactive chart…
🌏Named in Asian annual reportsinteractive
Loading the interactive chart…
🔄Rotation against the market and its industry (RRG)interactive
Loading the interactive chart…
🔍Earnings qualityinteractive
Loading the interactive chart…
⚖️Fair value by methodinteractive
Loading the interactive chart…
🔭Outlook & guidanceinteractive
Loading the interactive chart…
📈Investments: gains and what it boughtinteractive
Loading the interactive chart…
🏭Its industry’s money flow (input-output)interactive
Loading the interactive chart…
About Versigent
Versigent is a global leader in the purposeful design and advanced manufacturing of low and high voltage electrical architectures. Building on a legacy of engineering excellence and trusted partnerships, Versigent delivers versatile, intelligent solutions engineered to unlock greater capabilities for our customers. Powering one in six passenger vehicles in production today, Versigent’s high performance signal, power, and data distribution systems are trusted by industry leaders across automotive, commercial vehicles, agriculture and energy storage. With engineering and manufacturing centers on four continents and operations in more than 25 countries, Versigent’s approximately 138,000 employees match global scale with regional responsiveness to deliver consistent quality and reliable performance connecting the world to faster, smarter and safer experiences. Visit www.versigent.com .
In its own words, from its 8-K, filed Aug 4, 2026.
Versigent against its Motor Vehicle Parts & Accessories peers
The largest companies of the same SEC industry, each at its latest quarter. Revenue growth: +7% against the peers' median +2%. Operating margin: 7.6% against the peers' median 7.6%.
| Company | Quarter | Revenue | Y/Y | Op. margin |
|---|---|---|---|---|
| VGNT Versigent | Q3 2026 | $2.5B | +7% | 7.6% |
| LEA Lear | Q3 2026 | $5.8B | +2% | 3.4% |
| ADNT Adient | Q4 FY26 | $3.7B | +1% | -0.1% |
| BWA Borgwarner | Q3 2026 | $3.5B | -3% | 8.7% |
| APTV Aptiv | Q3 2026 | $3.2B | +2% | 8.8% |
| DCH Dauch | Q3 2026 | $2.9B | +93% | 2.5% |
| ALV Autoliv | Q3 2026 | $2.7B | -0.5% | 9.4% |
| DAN Dana | Q3 2026 | $2.0B | +6% | 4.5% |
| ALSN Allison Transmission Holdings | Q3 2026 | $1.5B | +121% | 19.8% |
Source: Versigent 10-Q on SEC EDGAR · CIK 2078008 · Motor Vehicle Parts & Accessories
Guidance and outlook
More on VGNT
History
Every quarter: Q3 2026 results · Q2 2026 results · Q1 2026 results