Filing Flows › Industrials › V2X (VVX)
V2X (VVX) earnings and revenue breakdown
Latest: Q3 2026 · 10-Q filed Nov 2, 2026 · V2X (VVX) Q3 2026 earnings results →
Q3 2026 Revenue up 9% year over year to $1.3B · 3¢ of every $1 of revenue kept as net profit · operating margin 4.7%
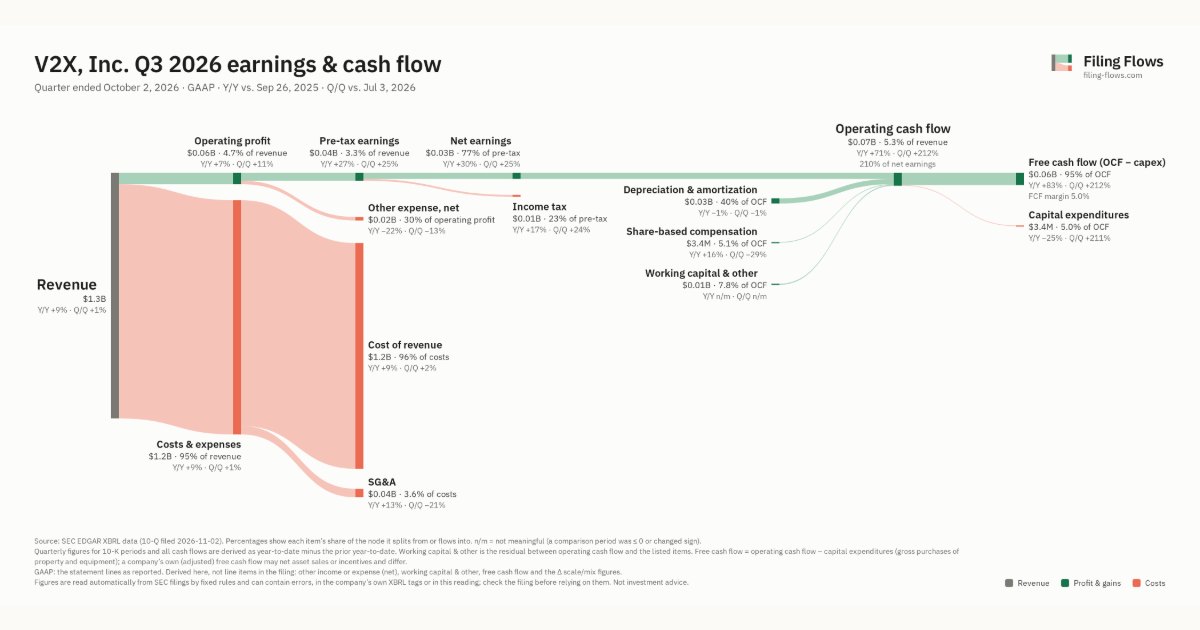
V2X made $1.3B in Q3 2026 (+9% Y/Y). Operating margin 4.7%, net earnings $32.0M. See where every dollar goes — costs, profit and cash — as a Sankey from the 10-Q filed Nov 2, 2026.
Drawing the Sankey…
Open the interactive Sankey → click any line for what the company wrote about it, compare Y/Y and Q/Q, export as PNG or PDF
What changed this quarter
Revenue was $1.3B in Q3 2026, up 9% year over year and up 1% from the previous quarter.
Operating profit was $0.06B, a 4.7% margin (down 0.1 points year over year). Of the extra revenue versus Q3 2025, 4% reached operating profit, below the 5% margin then. Total costs grew 9% against revenue growth of 9%. The fastest-growing cost line was SG&A (+13%). Net earnings were $0.03B, up 30% year over year. The effective tax rate was 22.9%.
Operating cash flow was $0.07B (up 71% year over year), 210% of net earnings. Non-cash charges added back $0.03B of depreciation and amortization and $3.4M of share-based compensation. Working capital and other items added $0.01B. Capital expenditures of $3.4M left free cash flow of $0.06B.
Quarterly history
| Quarter | Form | Filed | Revenue | Y/Y | Op. margin | Net earnings | Op. cash flow |
|---|---|---|---|---|---|---|---|
| Q3 2026 | 10-Q | Nov 2, 2026 | $1.3B | +9% | 4.7% | $32.0M | $67.3M |
| Q2 2026 | 10-Q | Aug 3, 2026 | $1.3B | +16% | 4.3% | $25.5M | $21.6M |
| Q1 2026 | 10-Q | May 4, 2026 | $1.3B | +23% | 3.5% | $18.9M | −$130M |
| Q4 2025 | 10-K | Feb 23, 2026 | $1.2B | +5% | 4.2% | $22.8M | $209M |
| Q3 2025 | 10-Q | Nov 3, 2025 | $1.2B | +8% | 4.8% | $24.6M | $39.4M |
| Q2 2025 | 10-Q | Aug 4, 2025 | $1.1B | +0.6% | 4.9% | $22.4M | $28.5M |
| Q1 2025 | 10-Q | May 5, 2025 | $1.0B | +0.5% | 3.4% | $8.1M | −$95.5M |
Charts
Interactive views
The same charts as the app — open one to draw it.
💵Where each $1 goesinteractive
Loading the interactive chart…
🌏Named in Asian annual reportsinteractive
Loading the interactive chart…
🔄Rotation against the market and its industry (RRG)interactive
Loading the interactive chart…
🔍Earnings qualityinteractive
Loading the interactive chart…
⚖️Fair value by methodinteractive
Loading the interactive chart…
🔭Outlook & guidanceinteractive
Loading the interactive chart…
📈Investments: gains and what it boughtinteractive
Loading the interactive chart…
🏭Its industry’s money flow (input-output)interactive
Loading the interactive chart…
Customers and suppliers named in filings
Sells to
- U.S. government — 42% of its revenue · Stated in 10-K (sentence) · source
About V2X
V2X , Inc. (V2X or the Company) is a leading provider of critical mission solutions primarily to defense customers in 349 locations and 49 countries and territories worldwide. V2X enables its customers' most important missions by delivering end-to-end capabilities at scale across the world. This provides us with the expertise and ability to act as a trusted partner to bring differentiated integrated solutions that define mission success. As of December 31, 2025, we had approximately 16,200 employees and 7,300 subcontract personnel. The Company operates as one segment and offers a broad suite of capabilities including multi-domain high impact readiness, integrated supply chain management, assured communications, mission solutions, and platform renewal and modernization to national security, defense, civilian and international customers.
In its own words, from its 10-K, filed Feb 23, 2026.
Source: V2X 10-Q on SEC EDGAR · CIK 1601548 · Services-Facilities Support Management Services
Guidance and outlook
13F: who owns VVX and who is buying
More on VVX
History
Every quarter: Q3 2026 results · Q2 2026 results · Q1 2026 results · Q4 2025 results · Q3 2025 results · Q2 2025 results · Q1 2025 results