Filing Flows › Consumer Discretionary › American Eagle Outfitters (AEO)
American Eagle Outfitters (AEO) earnings and revenue breakdown
Latest: Q2 FY27 · 10-Q filed Sep 10, 2026 · American Eagle Outfitters (AEO) Q2 FY27 earnings results →
Q2 FY27 Revenue up 8% year over year to $1.4B · 10¢ of every $1 of revenue kept as net profit · operating margin 15.3%
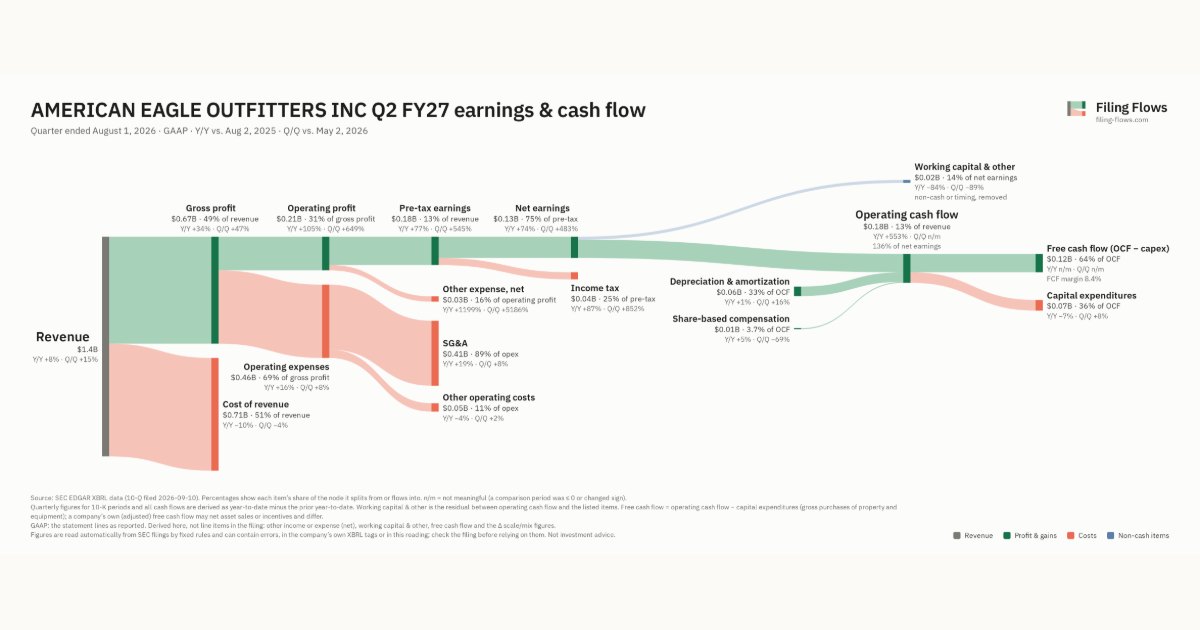
American Eagle Outfitters made $1.4B in Q2 FY27 (+8% Y/Y). Operating margin 15.3%, net earnings $134M. See where every dollar goes — costs, profit and cash — as a Sankey from the 10-Q filed Sep 10, 2026.
Drawing the Sankey…
Open the interactive Sankey → click any line for what the company wrote about it, compare Y/Y and Q/Q, export as PNG or PDF
What changed this quarter
Revenue was $1.4B in Q2 FY27, up 8% year over year and up 15% from the previous quarter.
Gross margin was 48.7%, up 9.7 points from Q2 FY26. Operating profit was $0.21B, a 15.3% margin (up 7.3 points year over year). Of the extra revenue versus Q2 FY26, 112% reached operating profit, above the 8% margin then. Operating expenses grew 16% against revenue growth of 8%. The fastest-growing cost line was SG&A (+19%). Net earnings were $0.13B, up 73% year over year. The effective tax rate was 24.9%.
Operating cash flow was $0.18B (up 553% year over year), 136% of net earnings. Non-cash charges added back $0.06B of depreciation and amortization and $0.01B of share-based compensation. Working capital and other items used $0.02B. Capital expenditures of $0.07B left free cash flow of $0.12B.
Quarterly history
| Quarter | Form | Filed | Revenue | Y/Y | Op. margin | Net earnings | Op. cash flow |
|---|---|---|---|---|---|---|---|
| Q2 FY27 | 10-Q | Sep 10, 2026 | $1.4B | +8% | 15.3% | $134M | $182M |
| Q1 FY27 | 10-Q | Jun 3, 2026 | $1.2B | +10% | 2.4% | $23.5M | −$65.2M |
| Q4 FY26 | 10-K | Mar 30, 2026 | $1.8B | +13% | 5.3% | $87.9M | $416M |
| Q3 FY26 | 10-Q | Dec 9, 2025 | $1.4B | +6% | 8.3% | $91.3M | $67.1M |
| Q2 FY26 | 10-Q | Sep 9, 2025 | $1.3B | -0.6% | 8.0% | $76.8M | $27.8M |
| Q1 FY26 | 10-Q | Jun 5, 2025 | $1.1B | -5% | -7.8% | −$65.4M | −$54.7M |
| Q4 FY25 | 10-K | Mar 20, 2025 | $1.6B | -4% | 8.9% | $104M | $384M |
Charts
Interactive views
The same charts as the app — open one to draw it.
💵Where each $1 goesinteractive
Loading the interactive chart…
🌏Named in Asian annual reportsinteractive
Loading the interactive chart…
🔄Rotation against the market and its industry (RRG)interactive
Loading the interactive chart…
🔍Earnings qualityinteractive
Loading the interactive chart…
⚖️Fair value by methodinteractive
Loading the interactive chart…
🔭Outlook & guidanceinteractive
Loading the interactive chart…
📈Investments: gains and what it boughtinteractive
Loading the interactive chart…
🏭Its industry’s money flow (input-output)interactive
Loading the interactive chart…
About American Eagle Outfitters
American Eagle Outfitters, Inc. (the "Company," "AEO," "we," "us," and "our") is a leading global specialty retailer with a portfolio of beloved apparel brands. We operate and license nearly 1,500 retail stores worldwide and are online at www.ae.com and www.aerie.com in the U.S. and internationally. Rooted in optimism, inclusivity, and authenticity, AEO’s brands empower every customer to celebrate their unique personal style. We offer casual, comfortable, timeless outfitting and high-quality products that are made to last under the American Eagle ("AE") brand, and intimates, apparel, activewear, and swim collections under the Aerie and OFFLINE by Aerie brands. We sell directly to consumers through our retail channels, which includes online, stores, and concession-based shops-within-shops. We operate stores in the U.S., Canada, and Mexico.
In its own words, from its 10-K, filed Mar 30, 2026.
American Eagle Outfitters against its Retail-Family Clothing Stores peers
The largest companies of the same SEC industry, each at its latest quarter. Revenue growth: +8% against the peers' median +5%. Operating margin: 15.3% against the peers' median 17.4%.
| Company | Quarter | Revenue | Y/Y | Op. margin |
|---|---|---|---|---|
| AEO American Eagle Outfitters | Q2 FY27 | $1.4B | +8% | 15.3% |
| TJX TJX Companies | Q2 FY27 | $15.2B | +5% | 13.3% |
| ROST Ross Stores | Q2 FY27 | $6.3B | +13% | 17.6% |
| GAP Gap | Q2 FY27 | $3.7B | -2% | 18.5% |
| URBN Urban Outfitters | Q2 FY27 | $1.7B | +10% | 17.4% |
| ANF Abercrombie & Fitch | Q2 FY27 | $1.3B | +5% | 19.9% |
| BKE Buckle | Q2 FY27 | $320M | +5% | 17.4% |
| LE Lands'' End | Q2 FY27 | $269M | +5% | 3.0% |
| PLCE Childrens Place | Q2 FY27 | $242M | -19% | -5.4% |
Source: American Eagle Outfitters 10-Q on SEC EDGAR · CIK 919012 · Retail-Family Clothing Stores
13F: who owns AEO and who is buying
More on AEO
History
Every quarter: Q2 FY27 results · Q1 FY27 results · Q4 FY26 results · Q3 FY26 results · Q2 FY26 results · Q1 FY26 results · Q4 FY25 results