Filing Flows › Health Care › agilon health (AGL)
agilon health (AGL) earnings and revenue breakdown
Latest: Q3 2026 · 10-Q filed Nov 4, 2026 · agilon health (AGL) Q3 2026 earnings results →
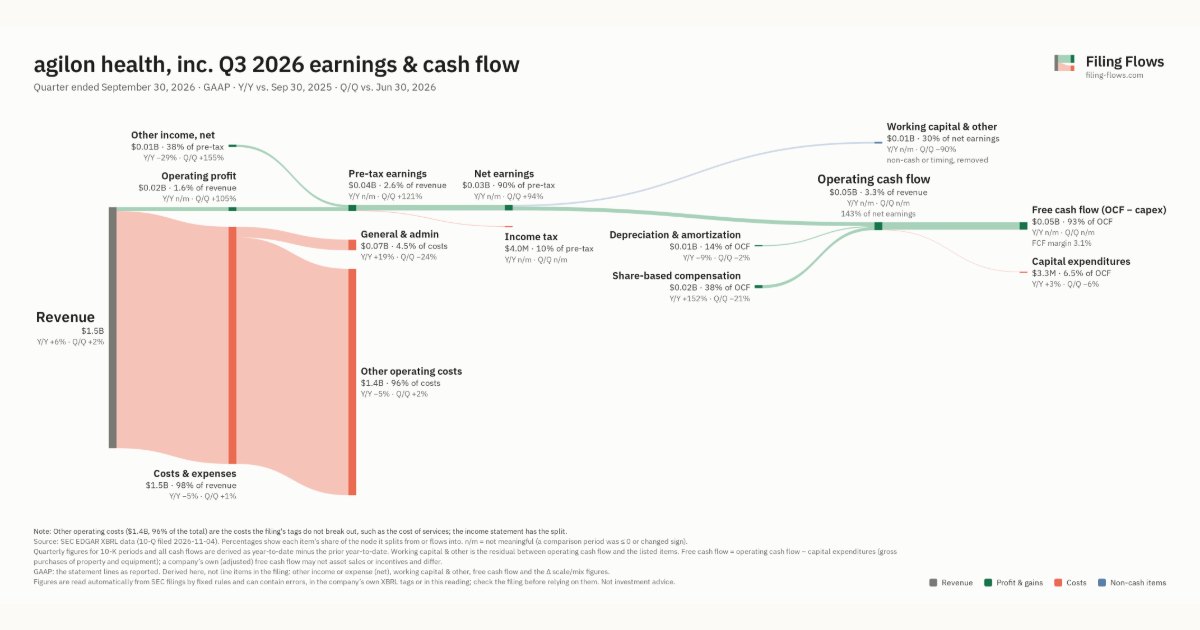
Q3 2026 Revenue up 6% year over year to $1.5B · 2¢ of every $1 of revenue kept as net profit · operating margin 1.6%
agilon health made $1.5B in Q3 2026 (+6% Y/Y). Operating margin 1.6%, net earnings $34.9M. See where every dollar goes — costs, profit and cash — as a Sankey from the 10-Q filed Nov 4, 2026.
Drawing the Sankey…
Open the interactive Sankey → click any line for what the company wrote about it, compare Y/Y and Q/Q, export as PNG or PDF
What changed this quarter
Revenue was $1.5B in Q3 2026, up 6% year over year and up 2% from the previous quarter.
Operating profit was $0.02B, a 1.6% margin (up 10.7 points year over year). Total costs fell 5% while revenue rose 6%. The fastest-growing cost line was General & admin (+19%). Net earnings were $0.03B. The effective tax rate was 10.3%. Non-operating items added $0.01B, 38% of pre-tax earnings, so the bottom line overstates operating performance.
Operating cash flow was $0.05B, 143% of net earnings. Non-cash charges added back $0.01B of depreciation and amortization and $0.02B of share-based compensation. Working capital and other items used $0.01B. Capital expenditures of $3.3M left free cash flow of $0.05B.
Quarterly history
| Quarter | Form | Filed | Revenue | Y/Y | Op. margin | Net earnings | Op. cash flow |
|---|---|---|---|---|---|---|---|
| Q3 2026 | 10-Q | Nov 4, 2026 | $1.5B | +6% | 1.6% | $34.9M | $49.9M |
| Q2 2026 | 10-Q | Aug 5, 2026 | $1.5B | +7% | 0.8% | $18.0M | −$57.3M |
| Q1 2026 | 10-Q | May 6, 2026 | $1.4B | -7% | 0.3% | $48.9M | $23.7M |
| Q4 2025 | 10-K | Feb 25, 2026 | $1.6B | +3% | -12.3% | −$189M | −$20.5M |
| Q3 2025 | 10-Q | Nov 4, 2025 | $1.4B | -1% | -9.1% | −$110M | −$18.2M |
| Q2 2025 | 10-Q | Aug 4, 2025 | $1.4B | -6% | -8.3% | −$104M | −$35.1M |
| Q1 2025 | 10-Q | May 6, 2025 | $1.5B | -4% | -1.4% | $12.1M | −$32.0M |
Charts
Interactive views
The same charts as the app — open one to draw it.
💵Where each $1 goesinteractive
Loading the interactive chart…
🌏Named in Asian annual reportsinteractive
Loading the interactive chart…
🔄Rotation against the market and its industry (RRG)interactive
Loading the interactive chart…
🔍Earnings qualityinteractive
Loading the interactive chart…
⚖️Fair value by methodinteractive
Loading the interactive chart…
🔭Outlook & guidanceinteractive
Loading the interactive chart…
📈Investments: gains and what it boughtinteractive
Loading the interactive chart…
🏭Its industry’s money flow (input-output)interactive
Loading the interactive chart…
About agilon health
Our business is transforming healthcare by empowering the primary care physicians (“PCP”) to be the agents for change in the communities they serve. We believe that PCPs, with their intimate patient-physician relationships, are best positioned to drive meaningful change in quality, cost and patient experience when provided with the right infrastructure and payment model. Through our combination of the agilon platform, a long-term partnership model with existing physician groups and a growing network of like-minded physicians, we believe we are poised to revolutionize healthcare for seniors across communities throughout the United States (“U.S.”). We believe our purpose-built model provides the necessary capabilities, capital and business model for existing physician groups to create a Medicare-centric, globally capitated line of business.
In its own words, from its 10-K, filed Feb 25, 2026.
agilon health against its Services-Misc Health & Allied Services, NEC peers
The largest companies of the same SEC industry, each at its latest quarter. Revenue growth: +6% against the peers' median +5%. Operating margin: 1.6% against the peers' median 8.9%.
| Company | Quarter | Revenue | Y/Y | Op. margin |
|---|---|---|---|---|
| AGL agilon health | Q3 2026 | $1.5B | +6% | 1.6% |
| DVA Davita | Q3 2026 | $3.6B | +5% | 14.0% |
| PGNY Progyny | Q3 2026 | $341M | +9% | 10.3% |
| SHC Sotera Health | Q3 2026 | $325M | +4% | 25.8% |
| VMD Viemed Healthcare | Q3 2026 | $80.7M | +12% | 8.6% |
| PARK Park Dental Partners | Q2 2026 | $66.2M | +5% | 1.9% |
| CCEL Cryo Cell International | Q3 FY26 | $7.8M | 0% | 28.0% |
| MRAI Marpai | Q2 2026 | $4.2M | -10% | -82.4% |
| PFHO Pacific Health Care Organization | Q3 2026 | $1.5M | -5% | 8.9% |
Source: agilon health 10-Q on SEC EDGAR · CIK 1831097 · Services-Misc Health & Allied Services, NEC
Guidance and outlook
13F: who owns AGL and who is buying
More on AGL
- How agilon health makes money: revenue by segment
- agilon health next earnings date and what analysts expect
- agilon health stock forecast, price target and fair value
- Who owns agilon health stock: holders, funds and Congress trades
- agilon health guidance and outlook
- Is agilon health a takeover target? LBO and rumors
History
Every quarter: Q3 2026 results · Q2 2026 results · Q1 2026 results · Q4 2025 results · Q3 2025 results · Q2 2025 results · Q1 2025 results