Filing Flows › Consumer Staples › Arko (ARKO)
Arko (ARKO) earnings and revenue breakdown
Latest: Q3 2026 · 10-Q filed Nov 5, 2026 · Arko (ARKO) Q3 2026 earnings results →
Q3 2026 Revenue up 18% year over year to $2.4B · 0¢ of every $1 of revenue kept as net profit · operating margin 1.5%
Arko made $2.4B in Q3 2026 (+18% Y/Y): Fuel Products $2.0B, Merchandise Products $351M, Other Product $32.3M. Operating margin 1.5%, net earnings $10.7M. See where every dollar goes — costs, profit and cash — as a Sankey from the 10-Q filed Nov 5, 2026.
Drawing the Sankey…
Open the interactive Sankey → click any line for what the company wrote about it, compare Y/Y and Q/Q, export as PNG or PDF
What changed this quarter
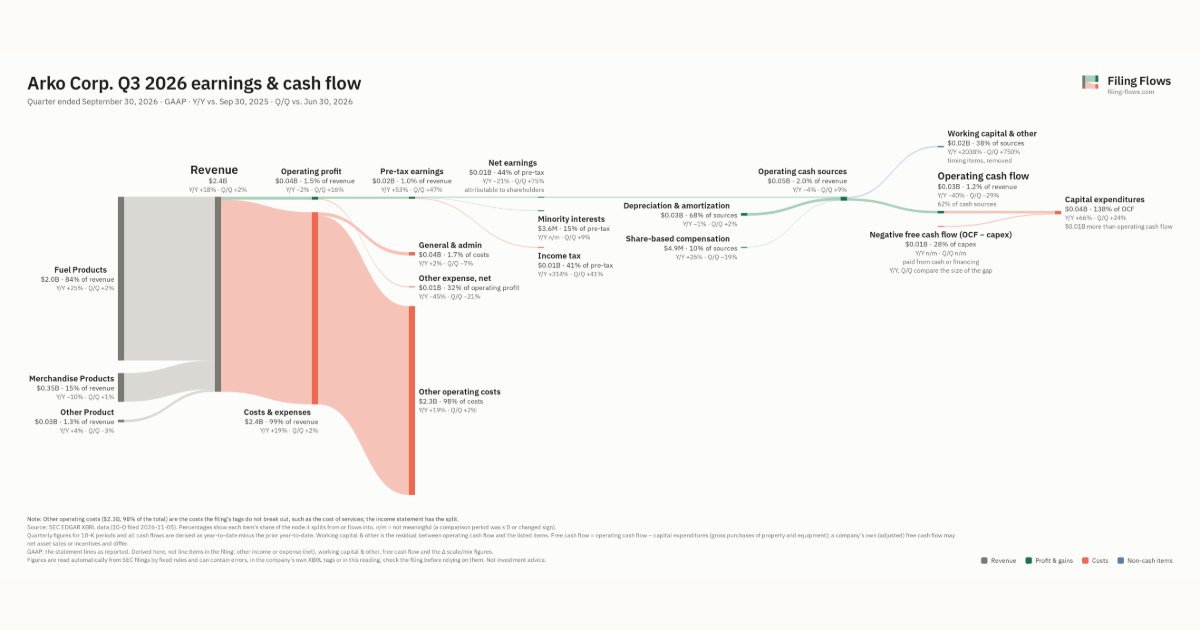
Revenue was $2.4B in Q3 2026, up 18% year over year and up 2% from the previous quarter. Fuel Products was the largest line at 84% of revenue. Fuel Products added $0.41B year over year (up 25%), 110% of the total change. Merchandise Products declined 10%.
Operating profit was $0.04B, a 1.5% margin (down 0.3 points year over year). Operating profit fell $695K even though revenue rose $0.37B versus Q3 2025, so costs grew faster than sales. Total costs grew 19% against revenue growth of 18%. The fastest-growing cost line was Other operating costs (+19%). Net earnings were $0.01B, down 21% year over year. The effective tax rate was 40.6%.
Operating cash flow was $0.03B (down 40% year over year), 209% of net income including minority interests. Non-cash charges added back $0.03B of depreciation and amortization and $4.9M of share-based compensation. Working capital and other items used $0.02B. Capital expenditures of $0.04B exceeded it, leaving free cash flow of −$0.01B.
Quarterly history
| Quarter | Form | Filed | Revenue | Y/Y | Op. margin | Net earnings | Op. cash flow |
|---|---|---|---|---|---|---|---|
| Q3 2026 | 10-Q | Nov 5, 2026 | $2.4B | +18% | 1.5% | $10.7M | $29.9M |
| Q2 2026 | 10-Q | Aug 7, 2026 | $2.3B | +17% | 1.3% | $6.1M | $42.2M |
| Q1 2026 | 10-Q | May 7, 2026 | $1.8B | -3% | 0.6% | −$5.6M | $18.7M |
| Q4 2025 | 10-K | Feb 25, 2026 | $1.8B | -10% | 1.2% | $1.9M | $44.6M |
| Q3 2025 | 10-Q | Nov 5, 2025 | $2.0B | -11% | 1.8% | $13.5M | $49.4M |
| Q2 2025 | 10-Q | Aug 6, 2025 | $2.0B | -16% | 2.8% | $20.1M | $55.2M |
| Q1 2025 | 10-Q | May 8, 2025 | $1.8B | -12% | -0.6% | −$12.7M | $43.4M |
Charts
Interactive views
The same charts as the app — open one to draw it.
💵Where each $1 goesinteractive
Loading the interactive chart…
🌏Named in Asian annual reportsinteractive
Loading the interactive chart…
🔄Rotation against the market and its industry (RRG)interactive
Loading the interactive chart…
🔍Earnings qualityinteractive
Loading the interactive chart…
⚖️Fair value by methodinteractive
Loading the interactive chart…
🔭Outlook & guidanceinteractive
Loading the interactive chart…
📈Investments: gains and what it boughtinteractive
Loading the interactive chart…
🏭Its industry’s money flow (input-output)interactive
Loading the interactive chart…
Customers and suppliers named in filings
Buys from
About Arko
Based in Richmond, Virginia, ARKO Corp. is one of the largest operators of convenience stores and wholesalers of fuel in the United States (“U.S.”), ranked by store count and gallons sold, respectively. As of December 31, 2025, we operated 1,118 retail convenience stores under more than 25 regional store brands. Our brands have been in existence for an average of more than 50 years, and we consider them “a Family of Community Brands.” While maintaining multiple established brand names, our stores derive significant value from the scale, corporate infrastructure and centralized marketing programs associated with our large network, including a common operating platform and a loyalty program that we use as a platform for promotions and marketing initiatives across our convenience stores.
In its own words, from its 10-K, filed Feb 25, 2026.
Source: Arko 10-Q on SEC EDGAR · CIK 1823794 · Retail-Convenience Stores
Guidance and outlook
13F: who owns ARKO and who is buying
More on ARKO
History
Every quarter: Q3 2026 results · Q2 2026 results · Q1 2026 results · Q4 2025 results · Q3 2025 results · Q2 2025 results · Q1 2025 results