Filing Flows › Technology › Broadcom (AVGO)
Broadcom (AVGO) earnings and revenue breakdown
Latest: Q3 FY26 · 10-Q filed Sep 10, 2026 · Broadcom (AVGO) Q3 FY26 earnings results →
Q3 FY26 Revenue up 86% year over year to $29.6B · 44¢ of every $1 of revenue kept as net profit · operating margin 53.9%
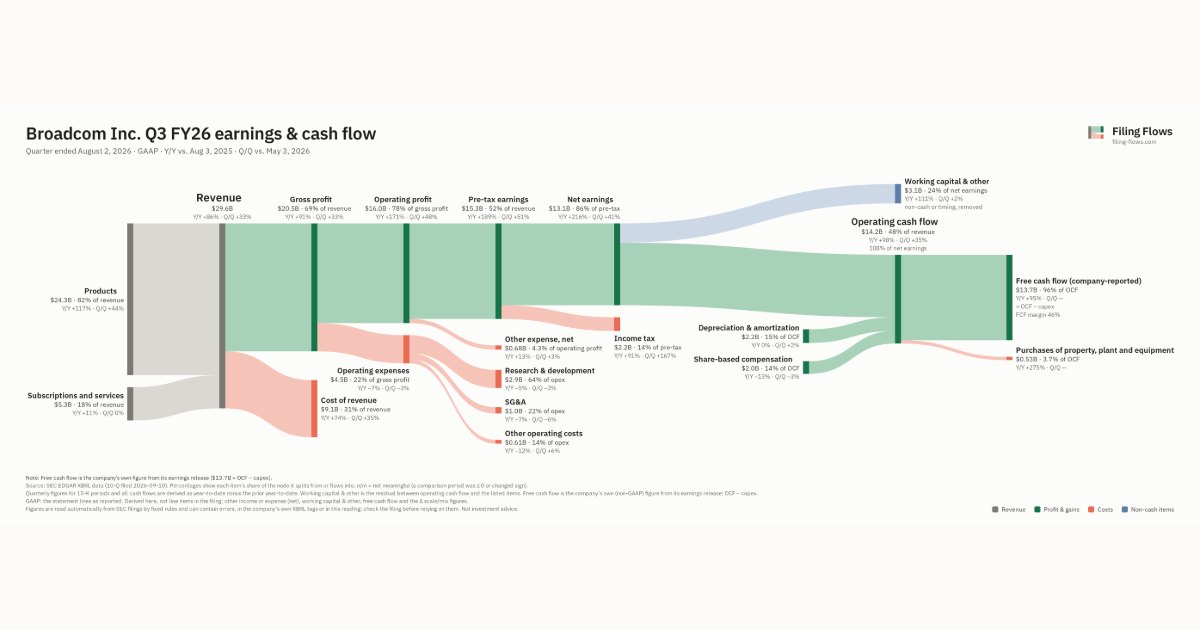
Broadcom made $29.6B in Q3 FY26 (+86% Y/Y): Products $24.3B, Subscriptions and services $5.3B. Operating margin 53.9%, net earnings $13.1B. See where every dollar goes — costs, profit and cash — as a Sankey from the 10-Q filed Sep 10, 2026.
Drawing the Sankey…
Open the interactive Sankey → click any line for what the company wrote about it, compare Y/Y and Q/Q, export as PNG or PDF
What changed this quarter
Revenue was $29.6B in Q3 FY26, up 86% year over year and up 33% from the previous quarter. Products was the largest line at 82% of revenue. Products added $13.1B year over year (up 117%), 96% of the total change.
Gross margin was 69.1%, up 2.0 points from Q3 FY25. Operating profit was $16.0B, a 53.9% margin (up 17.0 points year over year). Of the extra revenue versus Q3 FY25, 74% reached operating profit, above the 37% margin then. Operating expenses fell 7% while revenue rose 86%. Net earnings were $13.1B, up 216% year over year. The effective tax rate was 14.3%.
Operating cash flow was $14.2B (up 98% year over year), 108% of net earnings. Non-cash charges added back $2.2B of depreciation and amortization and $2.0B of share-based compensation. Working capital and other items used $3.1B. After purchases of property, plant and equipment ($0.53B), free cash flow as the company reports it was $13.7B.
Quarterly history
| Quarter | Form | Filed | Revenue | Y/Y | Op. margin | Net earnings | Op. cash flow |
|---|---|---|---|---|---|---|---|
| Q3 FY26 | 10-Q | Sep 10, 2026 | $29.6B | +86% | 53.9% | $13.1B | $14.2B |
| Q2 FY26 | 10-Q | Jun 9, 2026 | $22.2B | +48% | 48.6% | $9.3B | $10.5B |
| Q1 FY26 | 10-Q | Mar 11, 2026 | $19.3B | +30% | 44.3% | $7.3B | $8.3B |
| Q4 FY25 | 10-K | Dec 18, 2025 | $18.0B | +28% | 41.7% | $8.5B | $7.7B |
| Q3 FY25 | 10-Q | Sep 10, 2025 | $16.0B | +22% | 36.9% | $4.1B | $7.2B |
| Q2 FY25 | 10-Q | Jun 11, 2025 | $15.0B | +20% | 38.8% | $5.0B | $6.6B |
| Q4 FY24 | 10-K | Dec 20, 2024 | $14.1B | +51% | 32.9% | $4.3B | $5.6B |
Charts
In supply chains and themes
Interactive views
The same charts as the app — open one to draw it.
💵Where each $1 goesinteractive
Loading the interactive chart…
🌏Named in Asian annual reportsinteractive
Loading the interactive chart…
🔄Rotation against the market and its industry (RRG)interactive
Loading the interactive chart…
🔍Earnings qualityinteractive
Loading the interactive chart…
⚖️Fair value by methodinteractive
Loading the interactive chart…
🔭Outlook & guidanceinteractive
Loading the interactive chart…
📈Investments: gains and what it boughtinteractive
Loading the interactive chart…
🏭Its industry’s money flow (input-output)interactive
Loading the interactive chart…
About Broadcom
We are a global technology leader that designs, develops and supplies a broad range of semiconductor and semiconductor-based solutions and infrastructure software solutions. Our more than 60-year history of innovation dates back to our diverse origins from AT&T/Bell Labs, Lucent and Hewlett-Packard Company, and has evolved through acquisitions, including LSI Corporation, Broadcom Corporation, Brocade Communications Systems, Inc., CA, Inc., Symantec Enterprise Security, and VMware, Inc. (“VMware”). Over the years, we have assembled a large team of semiconductor and software design engineers around the world. We maintain design, product and software development engineering expertise and resources at locations primarily in the U.S., Asia, and Europe.
In its own words, from its 10-K, filed Dec 18, 2025.
Broadcom against its Semiconductors & Related Devices peers
The largest companies of the same SEC industry, each at its latest quarter. Revenue growth: +86% against the peers' median +40%. Operating margin: 53.9% against the peers' median 40.1%.
| Company | Quarter | Revenue | Y/Y | Op. margin |
|---|---|---|---|---|
| AVGO Broadcom | Q3 FY26 | $29.6B | +86% | 53.9% |
| NVDA NVIDIA | Q2 FY27 | $96.2B | +106% | 66.2% |
| MU Micron Technology | Q4 FY26 | $54.2B | +379% | 80.7% |
| INTC Intel | Q3 2026 | $16.5B | +21% | 15.3% |
| AMD Advanced Micro Devices | Q3 2026 | $13.4B | +45% | 21.2% |
| AMAT Applied Materials | Q3 FY26 | $9.1B | +25% | 33.7% |
| TXN Texas Instruments | Q3 2026 | $6.1B | +28% | 47.5% |
| ADI Analog Devices | Q3 FY26 | $4.0B | +40% | 40.1% |
| NXPI NXP Semiconductors N.V. | Q3 2026 | $3.8B | +19% | 32.4% |
Source: Broadcom 10-Q on SEC EDGAR · CIK 1730168 · Semiconductors & Related Devices
Guidance and outlook
13F: who owns AVGO and who is buying
More on AVGO
History
Every quarter: Q3 FY26 results · Q2 FY26 results · Q1 FY26 results · Q4 FY25 results · Q3 FY25 results · Q2 FY25 results · Q4 FY24 results
- Broadcom guidance history: guided vs reported
- Broadcom gross margin by quarter
- Broadcom operating margin by quarter
- Broadcom net income by quarter
- Broadcom free cash flow by quarter
- Broadcom R&D spending by quarter
- Broadcom capital expenditures by quarter
- Broadcom Products revenue by quarter
- Broadcom Subscriptions and services revenue by quarter