Filing Flows › Technology › Intel (INTC)
Intel (INTC) earnings and revenue breakdown
Latest: Q3 2026 · 10-Q filed Oct 30, 2026 · Intel (INTC) Q3 2026 earnings results →
Q3 2026 Revenue up 21% year over year to $16.5B · 20¢ of every $1 of revenue kept as net profit · operating margin 15.3%
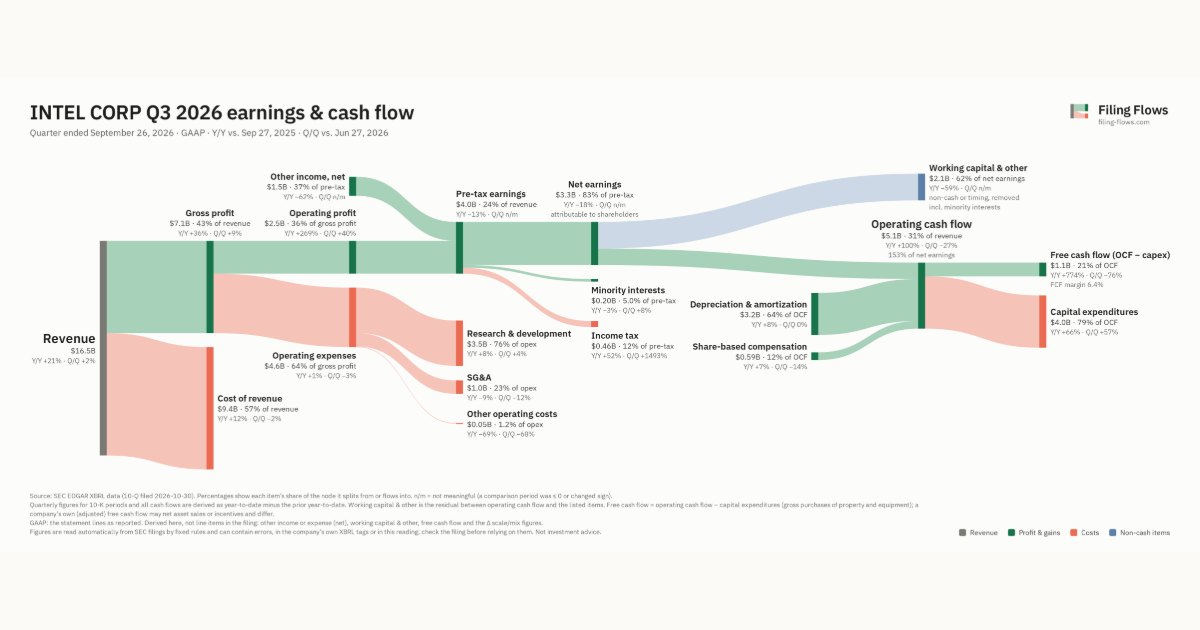
Intel made $16.5B in Q3 2026 (+21% Y/Y). Operating margin 15.3%, net earnings $3.3B. See where every dollar goes — costs, profit and cash — as a Sankey from the 10-Q filed Oct 30, 2026.
Drawing the Sankey…
Open the interactive Sankey → click any line for what the company wrote about it, compare Y/Y and Q/Q, export as PNG or PDF
What changed this quarter
Revenue was $16.5B in Q3 2026, up 21% year over year and up 2% from the previous quarter.
Gross margin was 43.0%, up 4.8 points from Q3 2025. Operating profit was $2.5B, a 15.3% margin (up 10.3 points year over year). Of the extra revenue versus Q3 2025, 64% reached operating profit, above the 5% margin then. Operating expenses grew 1% against revenue growth of 21%. Net earnings were $3.3B, down 18% year over year. The effective tax rate was 11.6%. Non-operating items added $1.5B, 37% of pre-tax earnings, so the bottom line overstates operating performance.
Operating cash flow was $5.1B (up 100% year over year), 144% of net income including minority interests. Non-cash charges added back $3.2B of depreciation and amortization and $0.59B of share-based compensation. Working capital and other items used $2.3B. Capital expenditures of $4.0B left free cash flow of $1.1B.
Quarterly history
| Quarter | Form | Filed | Revenue | Y/Y | Op. margin | Net earnings | Op. cash flow |
|---|---|---|---|---|---|---|---|
| Q3 2026 | 10-Q | Oct 30, 2026 | $16.5B | +21% | 15.3% | $3.3B | $5.1B |
| Q2 2026 | 10-Q | Jul 24, 2026 | $16.1B | +25% | 11.1% | −$10.8B | $7.0B |
| Q1 2026 | 10-Q | Apr 24, 2026 | $13.6B | +7% | -23.1% | −$4.3B | $1.1B |
| Q4 2025 | 10-K | Jan 23, 2026 | $13.7B | -4% | 4.2% | −$333M | $4.3B |
| Q3 2025 | 10-Q | Nov 6, 2025 | $13.7B | +3% | 5.0% | $4.1B | $2.5B |
| Q2 2025 | 10-Q | Jul 24, 2025 | $12.9B | +0.2% | -24.7% | −$3.0B | $2.0B |
| Q1 2025 | 10-Q | Apr 25, 2025 | $12.7B | -0.4% | -2.4% | −$887M | $813M |
Charts
Interactive views
The same charts as the app — open one to draw it.
💵Where each $1 goesinteractive
Loading the interactive chart…
🌏Named in Asian annual reportsinteractive
Loading the interactive chart…
🔄Rotation against the market and its industry (RRG)interactive
Loading the interactive chart…
🔍Earnings qualityinteractive
Loading the interactive chart…
⚖️Fair value by methodinteractive
Loading the interactive chart…
🔭Outlook & guidanceinteractive
Loading the interactive chart…
📈Investments: gains and what it boughtinteractive
Loading the interactive chart…
🏭Its industry’s money flow (input-output)interactive
Loading the interactive chart…
Customers and suppliers named in filings
Sells to
- DELL — 19% of its revenue · Stated in 10-K (XBRL) · source
- HPQ — 12% of its revenue · Stated in 10-K (XBRL) · source
- MXL · Stated in 10-K (named, share not stated) · source
- NATL · Stated in 10-K (named, share not stated) · source
Buys from
About Intel
Intel (Nasdaq: INTC) designs and manufactures advanced semiconductors that connect and power the modern world. Every day, our engineers create new technologies that enhance and shape the future of computing to enable new possibilities for every customer we serve. Learn more at www.intel.com.
In its own words, from its 8-K, filed Jul 23, 2026.
Intel against its Semiconductors & Related Devices peers
The largest companies of the same SEC industry, each at its latest quarter. Revenue growth: +21% against the peers' median +40%. Operating margin: 15.3% against the peers' median 40.1%.
| Company | Quarter | Revenue | Y/Y | Op. margin |
|---|---|---|---|---|
| INTC Intel | Q3 2026 | $16.5B | +21% | 15.3% |
| NVDA NVIDIA | Q2 FY27 | $96.2B | +106% | 66.2% |
| MU Micron Technology | Q4 FY26 | $54.2B | +379% | 80.7% |
| AVGO Broadcom | Q3 FY26 | $29.6B | +86% | 53.9% |
| AMD Advanced Micro Devices | Q3 2026 | $13.4B | +45% | 21.2% |
| AMAT Applied Materials | Q3 FY26 | $9.1B | +25% | 33.7% |
| TXN Texas Instruments | Q3 2026 | $6.1B | +28% | 47.5% |
| ADI Analog Devices | Q3 FY26 | $4.0B | +40% | 40.1% |
| NXPI NXP Semiconductors N.V. | Q3 2026 | $3.8B | +19% | 32.4% |
Source: Intel 10-Q on SEC EDGAR · CIK 50863 · Semiconductors & Related Devices
Guidance and outlook
13F: who owns INTC and who is buying
More on INTC
- How Intel makes money: revenue by segment
- Intel next earnings date and what analysts expect
- Intel stock forecast, price target and fair value
- Who owns Intel stock: holders, funds and Congress trades
- Intel guidance and outlook
- Is Intel a takeover target? LBO and rumors
- Intel recalls, complaints and regulation
History
Every quarter: Q3 2026 results · Q2 2026 results · Q1 2026 results · Q4 2025 results · Q3 2025 results · Q2 2025 results · Q1 2025 results