Filing Flows › Technology › HP (HPQ)
HP (HPQ) earnings and revenue breakdown
Latest: Q3 FY26 · 10-Q filed Aug 27, 2026 · HP (HPQ) Q3 FY26 earnings results →
Q3 FY26 Revenue up 12% year over year to $15.7B · 4¢ of every $1 of revenue kept as net profit · operating margin 5.7%
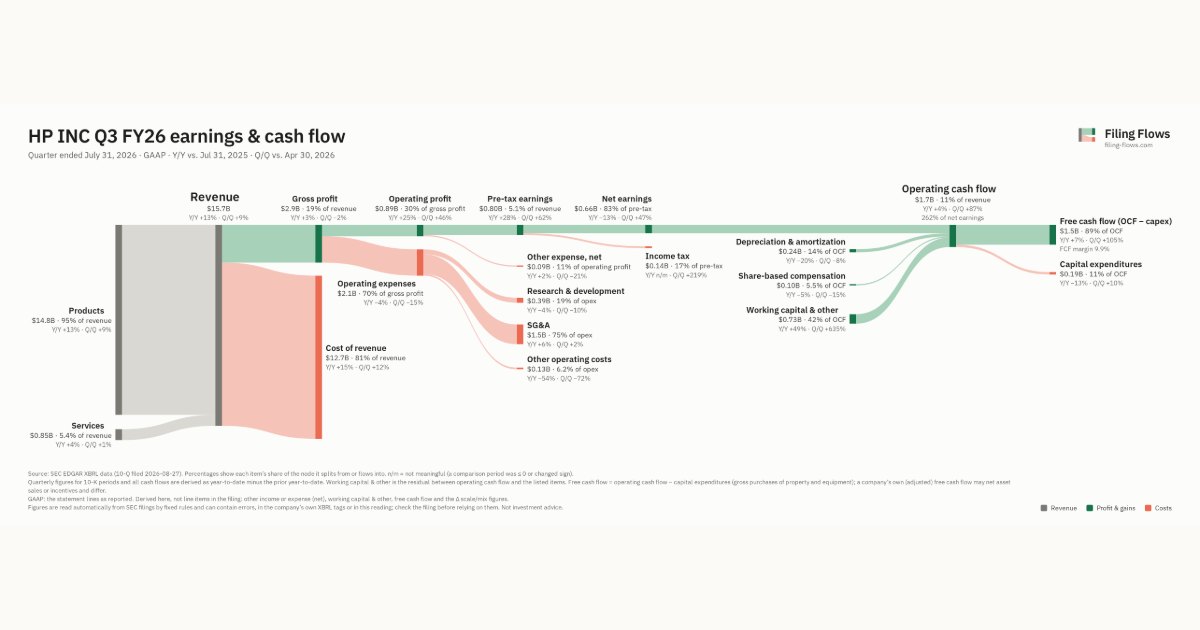
HP made $15.7B in Q3 FY26 (+12% Y/Y): Products $14.8B, Services $852M. Operating margin 5.7%, net earnings $661M. See where every dollar goes — costs, profit and cash — as a Sankey from the 10-Q filed Aug 27, 2026.
Drawing the Sankey…
Open the interactive Sankey → click any line for what the company wrote about it, compare Y/Y and Q/Q, export as PNG or PDF
What changed this quarter
Revenue was $15.7B in Q3 FY26, up 13% year over year and up 9% from the previous quarter. Products was the largest line at 95% of revenue. Products added $1.7B year over year (up 13%), 98% of the total change.
Gross margin was 18.8%, down 1.7 points from Q3 FY25. Operating profit was $0.89B, a 5.7% margin (up 0.6 points year over year). Of the extra revenue versus Q3 FY25, 10% reached operating profit, above the 5% margin then. Operating expenses fell 4% while revenue rose 13%. Net earnings were $0.66B, down 13% year over year. The effective tax rate was 17.2%.
Operating cash flow was $1.7B (up 4% year over year), 262% of net earnings. Non-cash charges added back $0.24B of depreciation and amortization and $0.10B of share-based compensation. Working capital and other items added $0.73B. Capital expenditures of $0.19B left free cash flow of $1.5B.
Quarterly history
| Quarter | Form | Filed | Revenue | Y/Y | Op. margin | Net earnings | Op. cash flow |
|---|---|---|---|---|---|---|---|
| Q3 FY26 | 10-Q | Aug 27, 2026 | $15.7B | +12% | 5.7% | $661M | $1.7B |
| Q2 FY26 | 10-Q | May 28, 2026 | $14.4B | +9% | 4.2% | $450M | $926M |
| Q1 FY26 | 10-Q | Feb 25, 2026 | $14.4B | +7% | 5.3% | $545M | $383M |
| Q4 FY25 | 10-K | Dec 10, 2025 | $14.6B | +4% | 6.6% | $795M | $1.6B |
| Q3 FY25 | 10-Q | Aug 28, 2025 | $13.9B | +3% | 5.1% | $763M | $1.7B |
| Q2 FY25 | 10-Q | May 29, 2025 | $13.2B | +3% | 4.9% | $406M | $38.0M |
| Q4 FY24 | 10-K | Dec 13, 2024 | $14.1B | +2% | 7.1% | $906M | $1.6B |
Charts
Interactive views
The same charts as the app — open one to draw it.
💵Where each $1 goesinteractive
Loading the interactive chart…
🌏Named in Asian annual reportsinteractive
Loading the interactive chart…
🔄Rotation against the market and its industry (RRG)interactive
Loading the interactive chart…
🔍Earnings qualityinteractive
Loading the interactive chart…
⚖️Fair value by methodinteractive
Loading the interactive chart…
🔭Outlook & guidanceinteractive
Loading the interactive chart…
📈Investments: gains and what it boughtinteractive
Loading the interactive chart…
🏭Its industry’s money flow (input-output)interactive
Loading the interactive chart…
Customers and suppliers named in filings
Sells to
- CNXN — 13% of its revenue · Stated in 10-K (sentence) · source
- BBY · Stated in 10-K (named, share not stated) · source
- SNX · Stated in 10-K (receivables) · source
Buys from
- INGM — 19% of the supplier’s revenue · Stated in 10-K (sentence) · source
- INTC — 12% of the supplier’s revenue · Stated in 10-K (XBRL) · source
- AMD · Stated in 10-K (named, share not stated) · source
- NVDA · Stated in 10-K (named, share not stated) · source
- STLY · Stated in 10-K (10% or more of revenue) · source
About HP
HP is a global technology leader and creator of solutions that enable people to bring their ideas to life and connect to the things that matter most. Operating in more than 170 countries, HP delivers innovative and sustainable devices, services and subscriptions for personal computing, printing, 3D printing, hybrid work, gaming and other related technologies. We believe artificial intelligence (“AI”) is playing a critical role in the transformation of how people live and work, and customers are beginning to recognize the benefits in security, speed and cost. Our high-performing product portfolio includes HP’s new line of AI PCs and workstations built with the computing power to enable local AI processing for enhanced performance and features as well as intelligent print features incorporated into our home, office and graphics solutions.
In its own words, from its 10-K, filed Dec 10, 2025.
HP against its Computer & office Equipment peers
The largest companies of the same SEC industry, each at its latest quarter. Revenue growth: +12% against the peers' median +12%. Operating margin: 5.7% against the peers' median 11.4%.
| Company | Quarter | Revenue | Y/Y | Op. margin |
|---|---|---|---|---|
| HPQ HP | Q3 FY26 | $15.7B | +12% | 5.7% |
| IBM International Business Machines | Q3 2026 | $17.1B | +5% | 14.5% |
| HPE Hewlett Packard Enterprise | Q3 FY26 | $12.2B | +34% | 11.4% |
Source: HP 10-Q on SEC EDGAR · CIK 47217 · Computer & office Equipment
Guidance and outlook
13F: who owns HPQ and who is buying
More on HPQ
History
Every quarter: Q3 FY26 results · Q2 FY26 results · Q1 FY26 results · Q4 FY25 results · Q3 FY25 results · Q2 FY25 results · Q4 FY24 results