Filing Flows › Industrials › TD Synnex (SNX)
TD Synnex (SNX) earnings and revenue breakdown
Latest: Q3 FY26 · 10-Q filed Oct 1, 2026 · TD Synnex (SNX) Q3 FY26 earnings results →
Q3 FY26 Revenue up 38% year over year to $21.6B · 2¢ of every $1 of revenue kept as net profit · operating margin 3.0%
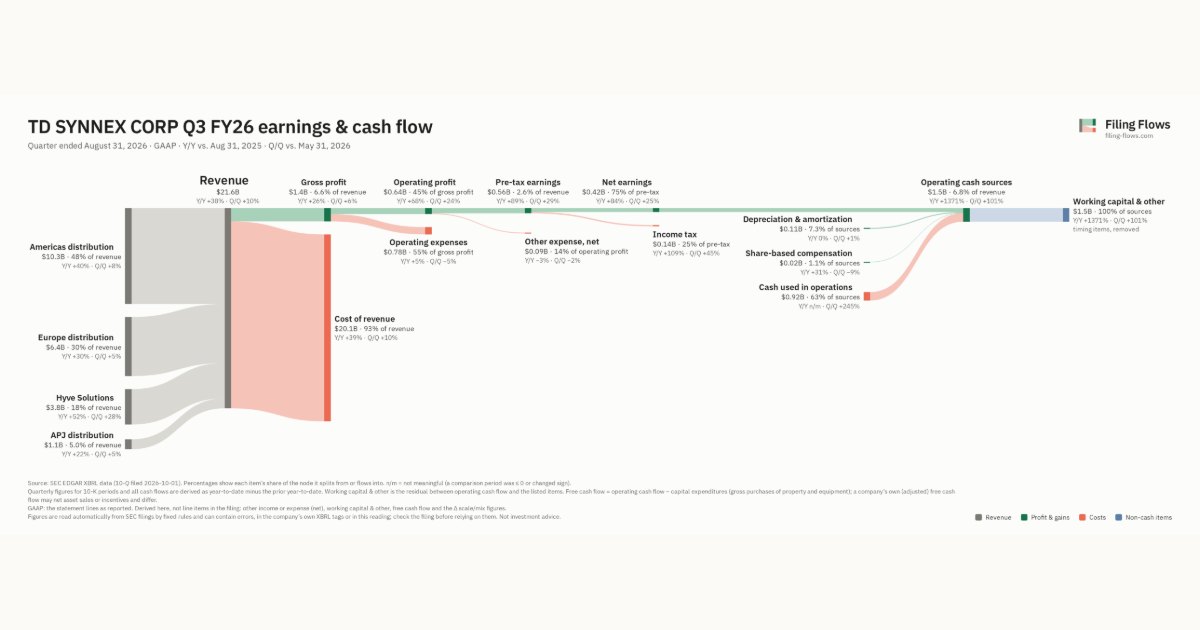
TD Synnex made $21.6B in Q3 FY26 (+38% Y/Y): Americas distribution $10.3B, Europe distribution $6.4B, Hyve Solutions $3.8B. Operating margin 3.0%, net earnings $416M. See where every dollar goes — costs, profit and cash — as a Sankey from the 10-Q filed Oct 1, 2026.
Drawing the Sankey…
Open the interactive Sankey → click any line for what the company wrote about it, compare Y/Y and Q/Q, export as PNG or PDF
What changed this quarter
Revenue was $21.6B in Q3 FY26, up 38% year over year and up 10% from the previous quarter. Americas distribution was the largest line at 48% of revenue. Americas distribution added $2.9B year over year (up 40%), 50% of the total change.
Gross margin was 6.6%, down 0.6 points from Q3 FY25. Operating profit was $0.64B, a 3.0% margin (up 0.5 points year over year). Of the extra revenue versus Q3 FY25, 4% reached operating profit, above the 2% margin then. Operating expenses grew 5% against revenue growth of 38%. Net earnings were $0.42B, up 84% year over year. The effective tax rate was 25.0%.
Operating cash flow was −$0.92B. Non-cash charges added back $0.11B of depreciation and amortization and $0.02B of share-based compensation. Working capital and other items used $1.5B. Capital expenditures of $0.06B exceeded it, leaving free cash flow of −$1.0B.
Quarterly history
| Quarter | Form | Filed | Revenue | Y/Y | Op. margin | Net earnings | Op. cash flow |
|---|---|---|---|---|---|---|---|
| Q3 FY26 | 10-Q | Oct 1, 2026 | $21.6B | +38% | 3.0% | $416M | −$917M |
| Q2 FY26 | 10-Q | Jul 2, 2026 | $19.6B | +31% | 2.7% | $334M | −$266M |
| Q1 FY26 | 10-Q | Apr 2, 2026 | $17.2B | +18% | 2.9% | $327M | −$896M |
| Q4 FY25 | 10-K | Jan 27, 2026 | $17.4B | +10% | 2.3% | $248M | $1.5B |
| Q3 FY25 | 10-Q | Oct 1, 2025 | $15.7B | +7% | 2.5% | $227M | $246M |
| Q2 FY25 | 10-Q | Jul 2, 2025 | $14.9B | +7% | 2.2% | $185M | $573M |
| Q4 FY24 | 10-K | Jan 24, 2025 | $15.8B | +10% | 2.0% | $195M | $562M |
Charts
Interactive views
The same charts as the app — open one to draw it.
💵Where each $1 goesinteractive
Loading the interactive chart…
🌏Named in Asian annual reportsinteractive
Loading the interactive chart…
🔄Rotation against the market and its industry (RRG)interactive
Loading the interactive chart…
🔍Earnings qualityinteractive
Loading the interactive chart…
⚖️Fair value by methodinteractive
Loading the interactive chart…
🔭Outlook & guidanceinteractive
Loading the interactive chart…
📈Investments: gains and what it boughtinteractive
Loading the interactive chart…
🏭Its industry’s money flow (input-output)interactive
Loading the interactive chart…
Customers and suppliers named in filings
Sells to
- CNXN — 25% of its revenue · Stated in 10-K (sentence) · source
- NSIT — 12% of its revenue · Stated in 10-K (sentence) · source
- CDW · Stated in 10-K (named, share not stated) · source
Buys from
- EXTR — 15% of the supplier’s revenue · Stated in 10-K (XBRL) · source
- ADSK — 14% of the supplier’s revenue · Stated in 10-K (sentence) · source
- LOGI — 12% of the supplier’s revenue · Stated in 10-K (sentence) · source
- AAPL · Stated in 10-K (share of revenue from its products) · source
- VISN · Stated in 10-K (10% or more of revenue) · source
- HPQ · Stated in 10-K (receivables) · source
About TD Synnex
We are a Fortune 100 corporation and a leading global distributor and solutions aggregator for the information technology ("IT") ecosystem. We serve a critical role, bringing products from the world's leading and emerging technology vendors to market, and helping our customers create solutions best suited to maximize business outcomes for their end-user customers. We aggregate and distribute IT hardware, software, and systems including personal computing devices and peripherals, mobile phones and accessories, printers, server and datacenter infrastructure, hybrid cloud, security, networking, communications and storage solutions, and system components. We also design and deliver purpose-built server, storage and networking solutions for the hyperscale computing infrastructure market.
In its own words, from its 10-K, filed Jan 27, 2026.
TD Synnex against its Wholesale-Computers & Peripheral Equipment & Software peers
The largest companies of the same SEC industry, each at its latest quarter. Revenue growth: +38% against the peers' median +30%. Operating margin: 3.0% against the peers' median 4.5%.
| Company | Quarter | Revenue | Y/Y | Op. margin |
|---|---|---|---|---|
| SNX TD Synnex | Q3 FY26 | $21.6B | +38% | 3.0% |
| INGM Ingram Micro Holding | Q3 2026 | $15.2B | +21% | 1.9% |
| SCSC Scansource | Q1 FY27 | $962M | +30% | 1.3% |
| CNXN PC Connection | Q3 2026 | $874M | +23% | 4.7% |
| PLUS Eplus | Q2 FY27 | $668M | +10% | 8.5% |
| CLMB Climb Global Solutions | Q3 2026 | $220M | +36% | 4.5% |
Source: TD Synnex 10-Q on SEC EDGAR · CIK 1177394 · Wholesale-Computers & Peripheral Equipment & Software
Guidance and outlook
13F: who owns SNX and who is buying
More on SNX
History
Every quarter: Q3 FY26 results · Q2 FY26 results · Q1 FY26 results · Q4 FY25 results · Q3 FY25 results · Q2 FY25 results · Q4 FY24 results
- TD Synnex guidance history: guided vs reported
- TD Synnex gross margin by quarter
- TD Synnex operating margin by quarter
- TD Synnex net income by quarter
- TD Synnex free cash flow by quarter
- TD Synnex capital expenditures by quarter
- TD Synnex Americas distribution revenue by quarter
- TD Synnex Europe distribution revenue by quarter
- TD Synnex Hyve Solutions revenue by quarter