Filing Flows › Consumer Discretionary › Insight Enterprises (NSIT)
Insight Enterprises (NSIT) earnings and revenue breakdown
Latest: Q3 2026 · 10-Q filed Nov 5, 2026 · Insight Enterprises (NSIT) Q3 2026 earnings results →
Q3 2026 Revenue up 22% year over year to $2.4B · 1¢ of every $1 of revenue kept as net profit · operating margin 2.8%
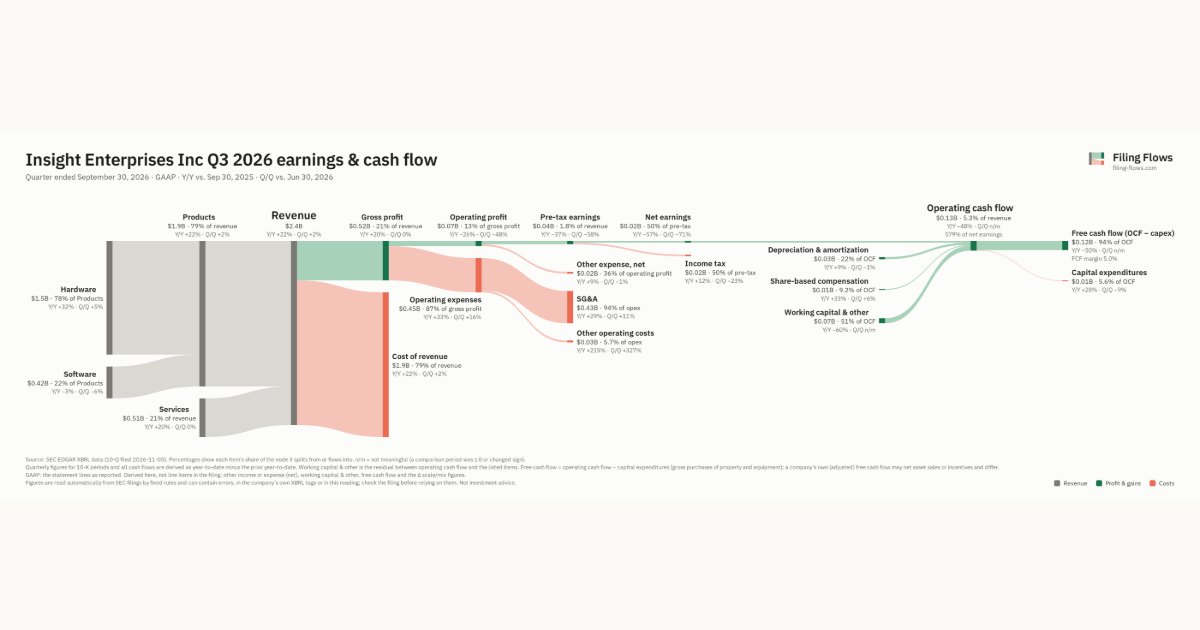
Insight Enterprises made $2.4B in Q3 2026 (+22% Y/Y): Products $1.9B, Services $512M. Operating margin 2.8%, net earnings $22.2M. See where every dollar goes — costs, profit and cash — as a Sankey from the 10-Q filed Nov 5, 2026.
Drawing the Sankey…
Open the interactive Sankey → click any line for what the company wrote about it, compare Y/Y and Q/Q, export as PNG or PDF
What changed this quarter
Revenue was $2.4B in Q3 2026, up 22% year over year and up 2% from the previous quarter. Hardware was the largest line at 62% of revenue. Hardware added $0.36B year over year (up 32%), 83% of the total change. Software declined 3%.
Gross margin was 21.4%, down 0.2 points from Q3 2025. Operating profit was $0.07B, a 2.8% margin (down 1.8 points year over year). Operating profit fell $0.02B even though revenue rose $0.44B versus Q3 2025, so costs grew faster than sales. Operating expenses grew 33% against revenue growth of 22%. The fastest-growing cost line was Other operating costs (+215%). Net earnings were $0.02B, down 57% year over year. The effective tax rate was 49.9%.
Operating cash flow was $0.13B (down 48% year over year), 579% of net earnings. Non-cash charges added back $0.03B of depreciation and amortization and $0.01B of share-based compensation. Working capital and other items added $0.07B. Capital expenditures of $0.01B left free cash flow of $0.12B.
Quarterly history
| Quarter | Form | Filed | Revenue | Y/Y | Op. margin | Net earnings | Op. cash flow |
|---|---|---|---|---|---|---|---|
| Q3 2026 | 10-Q | Nov 5, 2026 | $2.4B | +22% | 2.8% | $22.2M | $128M |
| Q2 2026 | 10-Q | Aug 6, 2026 | $2.4B | +15% | 5.5% | $77.6M | −$12.2M |
| Q1 2026 | 10-Q | May 7, 2026 | $2.1B | +1% | 3.4% | $30.0M | $32.4M |
| Q4 2025 | 10-K | Feb 12, 2026 | $2.0B | -1% | 4.6% | $52.0M | $154M |
| Q3 2025 | 10-Q | Oct 30, 2025 | $2.0B | -4% | 4.6% | $50.9M | $249M |
| Q2 2025 | 10-Q | Jul 31, 2025 | $2.1B | -3% | 4.1% | $46.9M | −$177M |
| Q1 2025 | 10-Q | May 1, 2025 | $2.1B | -12% | 2.9% | $7.5M | $78.0M |
Charts
Interactive views
The same charts as the app — open one to draw it.
💵Where each $1 goesinteractive
Loading the interactive chart…
🌏Named in Asian annual reportsinteractive
Loading the interactive chart…
🔄Rotation against the market and its industry (RRG)interactive
Loading the interactive chart…
🔍Earnings qualityinteractive
Loading the interactive chart…
⚖️Fair value by methodinteractive
Loading the interactive chart…
🔭Outlook & guidanceinteractive
Loading the interactive chart…
📈Investments: gains and what it boughtinteractive
Loading the interactive chart…
🏭Its industry’s money flow (input-output)interactive
Loading the interactive chart…
Customers and suppliers named in filings
Buys from
- MSFT — 32% of the supplier’s revenue · Stated in 10-K (sentence) · source
- SNX — 12% of the supplier’s revenue · Stated in 10-K (sentence) · source
About Insight Enterprises
Today, every business is a technology business. At Insight, we accelerate transformation by unlocking the power of people and technology. We turn complexity into clarity, helping clients achieve meaningful business outcomes and drive real results at scale. We serve these clients in North America; Europe, the Middle East and Africa (“EMEA”); and Asia-Pacific (“APAC”). As a Fortune 500-ranked Solutions Integrator, we deliver secure, end-to-end digital transformation and meet the needs of our clients through a comprehensive portfolio of solutions, far-reaching partnerships and 37 years of broad IT expertise. We amplify our solutions and services with global scale, local expertise and our e-commerce experience, enabling our clients to realize their digital ambitions in multiple ways.
In its own words, from its 10-K, filed Feb 12, 2026.
Insight Enterprises against its Retail-Catalog & Mail-Order Houses peers
The largest companies of the same SEC industry, each at its latest quarter. Revenue growth: +22% against the peers' median +10%. Operating margin: 2.8% against the peers' median 3.1%.
| Company | Quarter | Revenue | Y/Y | Op. margin |
|---|---|---|---|---|
| NSIT Insight Enterprises | Q3 2026 | $2.4B | +22% | 2.8% |
| AMZN Amazon.com | Q3 2026 | $201.9B | +12% | 13.9% |
| CPNG Coupang | Q3 2026 | $10.0B | +8% | -4.5% |
| CDW CDW | Q3 2026 | $6.8B | +18% | 7.2% |
| W Wayfair | Q3 2026 | $3.4B | +10% | 3.1% |
| CHWY Chewy | Q2 FY27 | $3.3B | +7% | 2.8% |
| Old QVC Group | Q2 2026 | $2.0B | -11% | 2.6% |
| QVCG QVC Group | Q2 2026 | $1.8B | -11% | 3.5% |
| PTRN Pattern Group | Q3 2026 | $886M | +38% | 4.2% |
Source: Insight Enterprises 10-Q on SEC EDGAR · CIK 932696 · Retail-Catalog & Mail-Order Houses
Guidance and outlook
13F: who owns NSIT and who is buying
More on NSIT
- How Insight Enterprises makes money: revenue by segment
- Insight Enterprises next earnings date and what analysts expect
- Insight Enterprises stock forecast, price target and fair value
- Who owns Insight Enterprises stock: holders, funds and Congress trades
- Insight Enterprises guidance and outlook
- Is Insight Enterprises a takeover target? LBO and rumors
History
Every quarter: Q3 2026 results · Q2 2026 results · Q1 2026 results · Q4 2025 results · Q3 2025 results · Q2 2025 results · Q1 2025 results
- Insight Enterprises guidance history: guided vs reported
- Insight Enterprises gross margin by quarter
- Insight Enterprises operating margin by quarter
- Insight Enterprises net income by quarter
- Insight Enterprises free cash flow by quarter
- Insight Enterprises capital expenditures by quarter
- Insight Enterprises Products revenue by quarter
- Insight Enterprises Services revenue by quarter