Filing Flows › Consumer Discretionary › QVC Group (QVCG)
QVC Group (QVCG) earnings and revenue breakdown
Latest: Q2 2026 · 10-Q filed Aug 4, 2026 · QVC Group (QVCG) Q2 2026 earnings results →
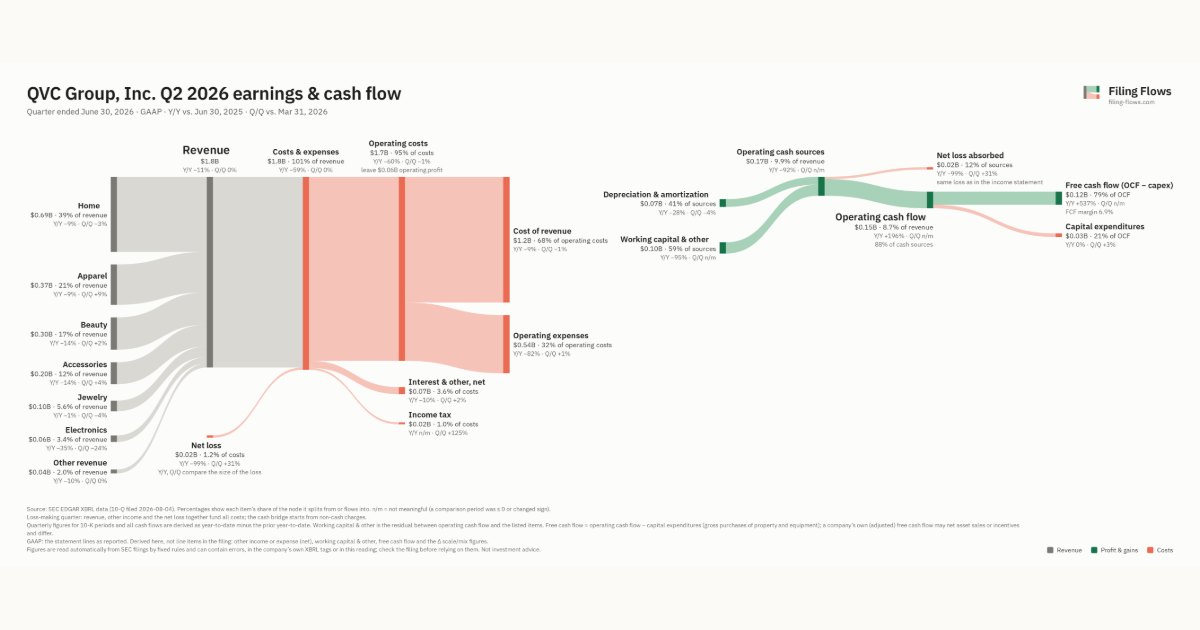
Q2 2026 Revenue down 11% year over year to $1.8B · 1¢ of every $1 of revenue lost · operating margin 3.5%
QVC Group made $1.8B in Q2 2026 (-11% Y/Y): Home $695M, Apparel $374M, Beauty $299M. Operating margin 3.5%, net loss $21.0M. See where every dollar goes — costs, profit and cash — as a Sankey from the 10-Q filed Aug 4, 2026.
Drawing the Sankey…
Open the interactive Sankey → click any line for what the company wrote about it, compare Y/Y and Q/Q, export as PNG or PDF
What changed this quarter
Revenue was $1.8B in Q2 2026, down 11% year over year and roughly flat from the previous quarter. Home was the largest line at 39% of revenue. Home lost $0.07B year over year (down 9%), 30% of the total change.
Gross margin was 34.1%, down 1.4 points from Q2 2025. Operating profit was $0.06B, a 3.5% margin (up 118.0 points year over year). Operating expenses fell 82% while revenue fell 11%. The quarter ended with a net loss of $0.02B, wider than the previous quarter's $0.02B loss. Net interest and other expense of $0.07B was the main reason.
Operating cash flow was $0.15B (up 196% year over year). Non-cash charges added back $0.07B of depreciation and amortization. Working capital and other items added $0.10B. Capital expenditures of $0.03B left free cash flow of $0.12B.
Quarterly history
| Quarter | Form | Filed | Revenue | Y/Y | Op. margin | Net earnings | Op. cash flow |
|---|---|---|---|---|---|---|---|
| Q2 2026 | 10-Q | Aug 4, 2026 | $1.8B | -11% | 3.5% | −$21.0M | $154M |
| Q1 2026 | 10-Q | May 15, 2026 | $1.8B | -7% | 3.2% | −$16.0M | −$98.0M |
| Q4 2025 | 10-K | Apr 15, 2026 | $2.4B | -9% | 5.6% | $37.0M | $245M |
| Q3 2025 | 10-Q | Nov 5, 2025 | $2.0B | -5% | 4.6% | $2.0M | $76.0M |
| Q2 2025 | 10-Q | Aug 7, 2025 | $2.0B | -7% | -114.5% | −$2.2B | $52.0M |
| Q1 2025 | 10-Q | May 7, 2025 | $1.9B | -10% | 1.5% | −$33.0M | $46.0M |
| Q4 2024 | 10-K | Feb 27, 2025 | $2.7B | -6% | -47.1% | −$1.2B | $189M |
Charts
Interactive views
The same charts as the app — open one to draw it.
💵Where each $1 goesinteractive
Loading the interactive chart…
🌏Named in Asian annual reportsinteractive
Loading the interactive chart…
🔄Rotation against the market and its industry (RRG)interactive
Loading the interactive chart…
🔍Earnings qualityinteractive
Loading the interactive chart…
⚖️Fair value by methodinteractive
Loading the interactive chart…
🔭Outlook & guidanceinteractive
Loading the interactive chart…
📈Investments: gains and what it boughtinteractive
Loading the interactive chart…
🏭Its industry’s money flow (input-output)interactive
Loading the interactive chart…
About QVC Group
Certain statements in this Annual Report on Form 10-K constitute forward-looking statements within the meaning of the Private Securities Litigation Reform Act of 1995, including statements regarding our business, product and marketing strategies, including the outcome and effects of the Chapter 11 Cases (as defined below) (including our ability to successfully emerge from the process and the timing thereof); our WIN strategy; capital expenditures, revenue growth; statements regarding the recoverability of our goodwill and other long-lived assets; our projected sources and uses of cash; repayment of debt; economic and macroeconomic trends; and the anticipated impact of certain contingent liabilities related to legal and tax proceedings and other matters arising in the ordinary course of business.
In its own words, from its 10-K, filed Apr 15, 2026.
QVC Group against its Retail-Catalog & Mail-Order Houses peers
The largest companies of the same SEC industry, each at its latest quarter. Revenue growth: -11% against the peers' median +10%. Operating margin: 3.5% against the peers' median 3.1%.
| Company | Quarter | Revenue | Y/Y | Op. margin |
|---|---|---|---|---|
| QVCG QVC Group | Q2 2026 | $1.8B | -11% | 3.5% |
| AMZN Amazon.com | Q3 2026 | $201.9B | +12% | 13.9% |
| CPNG Coupang | Q3 2026 | $10.0B | +8% | -4.5% |
| CDW CDW | Q3 2026 | $6.8B | +18% | 7.2% |
| W Wayfair | Q3 2026 | $3.4B | +10% | 3.1% |
| CHWY Chewy | Q2 FY27 | $3.3B | +7% | 2.8% |
| NSIT Insight Enterprises | Q3 2026 | $2.4B | +22% | 2.8% |
| Old QVC Group | Q2 2026 | $2.0B | -11% | 2.6% |
| PTRN Pattern Group | Q3 2026 | $886M | +38% | 4.2% |
Source: QVC Group 10-Q on SEC EDGAR · CIK 1254699 · Retail-Catalog & Mail-Order Houses
More on QVCG
History
Every quarter: Q2 2026 results · Q1 2026 results · Q4 2025 results · Q3 2025 results · Q2 2025 results · Q1 2025 results · Q4 2024 results