Filing Flows › Consumer Discretionary › Wayfair (W)
Wayfair (W) earnings and revenue breakdown
Latest: Q3 2026 · 10-Q filed Nov 4, 2026 · Wayfair (W) Q3 2026 earnings results →
Q3 2026 Revenue up 10% year over year to $3.4B · 2¢ of every $1 of revenue kept as net profit · operating margin 3.1%
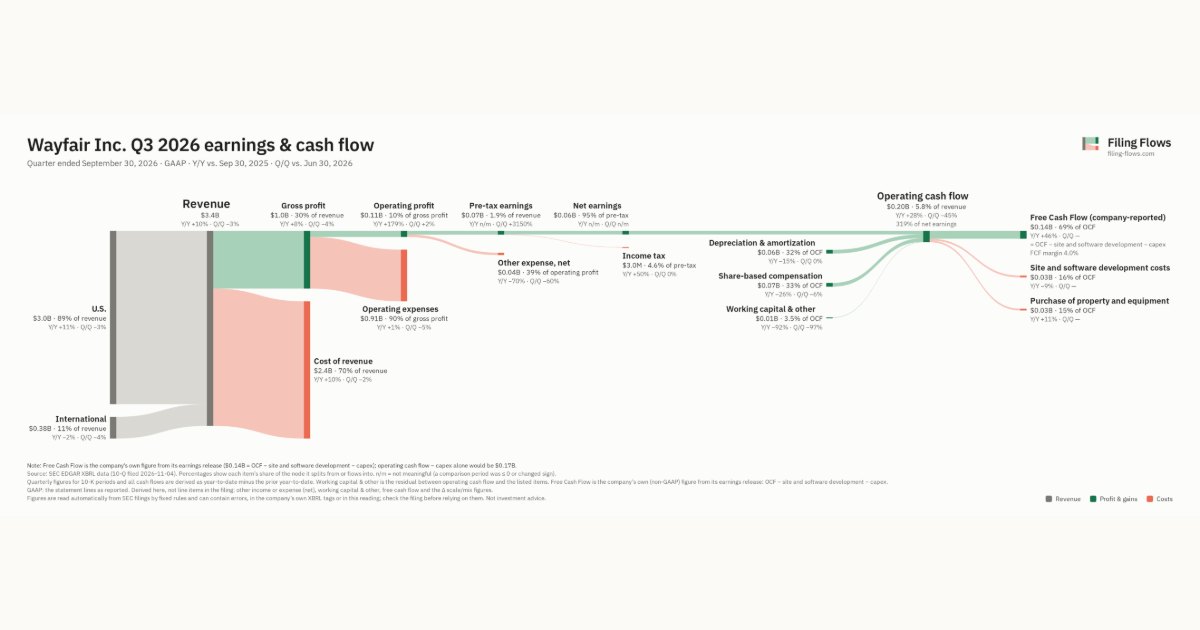
Wayfair made $3.4B in Q3 2026 (+10% Y/Y): U.S. $3.0B, International $380M. Operating margin 3.1%, net earnings $62.0M. See where every dollar goes — costs, profit and cash — as a Sankey from the 10-Q filed Nov 4, 2026.
Drawing the Sankey…
Open the interactive Sankey → click any line for what the company wrote about it, compare Y/Y and Q/Q, export as PNG or PDF
What changed this quarter
Revenue was $3.4B in Q3 2026, up 10% year over year and down 3% from the previous quarter. U.S. was the largest line at 89% of revenue. U.S. added $0.31B year over year (up 11%), 103% of the total change. International declined 2%.
Gross margin was 29.6%, down 0.4 points from Q3 2025. Operating profit was $0.11B, a 3.1% margin (up 1.9 points year over year). Of the extra revenue versus Q3 2025, 22% reached operating profit, above the 1% margin then. Operating expenses grew 1% against revenue growth of 10%. Net earnings were $0.06B. The effective tax rate was 4.6%.
Operating cash flow was $0.20B (up 28% year over year), 319% of net earnings. Non-cash charges added back $0.06B of depreciation and amortization and $0.07B of share-based compensation. After site and software development costs ($0.03B) and purchase of property and equipment ($0.03B), free cash flow as the company reports it was $0.14B.
Quarterly history
| Quarter | Form | Filed | Revenue | Y/Y | Op. margin | Net earnings | Op. cash flow |
|---|---|---|---|---|---|---|---|
| Q3 2026 | 10-Q | Nov 4, 2026 | $3.4B | +10% | 3.1% | $62.0M | $198M |
| Q2 2026 | 10-Q | Aug 4, 2026 | $3.5B | +8% | 3.0% | −$1.0M | $360M |
| Q1 2026 | 10-Q | Apr 30, 2026 | $2.9B | +7% | -0.4% | −$105M | −$52.0M |
| Q4 2025 | 10-K | Feb 19, 2026 | $3.3B | +7% | 2.5% | −$116M | $202M |
| Q3 2025 | 10-Q | Oct 28, 2025 | $3.1B | +8% | 1.2% | −$99.0M | $155M |
| Q2 2025 | 10-Q | Aug 4, 2025 | $3.3B | +5% | 0.5% | $15.0M | $273M |
| Q1 2025 | 10-Q | May 1, 2025 | $2.7B | 0% | -4.5% | −$113M | −$96.0M |
Charts
Interactive views
The same charts as the app — open one to draw it.
💵Where each $1 goesinteractive
Loading the interactive chart…
🌏Named in Asian annual reportsinteractive
Loading the interactive chart…
🔄Rotation against the market and its industry (RRG)interactive
Loading the interactive chart…
🔍Earnings qualityinteractive
Loading the interactive chart…
⚖️Fair value by methodinteractive
Loading the interactive chart…
🔭Outlook & guidanceinteractive
Loading the interactive chart…
📈Investments: gains and what it boughtinteractive
Loading the interactive chart…
🏭Its industry’s money flow (input-output)interactive
Loading the interactive chart…
Customers and suppliers named in filings
Buys from
- KPLT — 10% of the supplier’s revenue · Stated in 10-K (XBRL) · source
- GOOGL · Stated in 10-K (named, share not stated) · source
- FDX · Stated in 10-K (named, share not stated) · source
About Wayfair
As used herein, “Wayfair,” “the company,” “we,” “us,” “our” and similar terms refer to Wayfair Inc. and its subsidiaries, unless the context indicates otherwise. Wayfair is the destination for all things home. Through our e-commerce platform, we offer customers visually inspired browsing, compelling merchandising, easy product discovery and attractive prices. We are focused on bringing our customers an experience that is at the forefront of shopping for the home online. Our customers span a wide range of demographics, with annual household incomes typically ranging from $25,000 to over $250,000, and also include businesses, from small startups to global enterprises. Our selections of furniture, décor, housewares and home improvement products appeal to our customers’ different tastes, styles, purchasing goals and budgets when shopping for their homes and businesses.
In its own words, from its 10-K, filed Feb 19, 2026.
Wayfair against its Retail-Catalog & Mail-Order Houses peers
The largest companies of the same SEC industry, each at its latest quarter. Revenue growth: +10% against the peers' median +10%. Operating margin: 3.1% against the peers' median 3.1%.
| Company | Quarter | Revenue | Y/Y | Op. margin |
|---|---|---|---|---|
| W Wayfair | Q3 2026 | $3.4B | +10% | 3.1% |
| AMZN Amazon.com | Q3 2026 | $201.9B | +12% | 13.9% |
| CPNG Coupang | Q3 2026 | $10.0B | +8% | -4.5% |
| CDW CDW | Q3 2026 | $6.8B | +18% | 7.2% |
| CHWY Chewy | Q2 FY27 | $3.3B | +7% | 2.8% |
| NSIT Insight Enterprises | Q3 2026 | $2.4B | +22% | 2.8% |
| Old QVC Group | Q2 2026 | $2.0B | -11% | 2.6% |
| QVCG QVC Group | Q2 2026 | $1.8B | -11% | 3.5% |
| PTRN Pattern Group | Q3 2026 | $886M | +38% | 4.2% |
Source: Wayfair 10-Q on SEC EDGAR · CIK 1616707 · Retail-Catalog & Mail-Order Houses
Guidance and outlook
13F: who owns W and who is buying
More on W
History
Every quarter: Q3 2026 results · Q2 2026 results · Q1 2026 results · Q4 2025 results · Q3 2025 results · Q2 2025 results · Q1 2025 results