Filing Flows › Industrials › FedEx (FDX)
FedEx (FDX) earnings and revenue breakdown
Latest: Q1 FY27 · 10-Q filed Oct 28, 2026 · FedEx (FDX) Q1 FY27 earnings results →
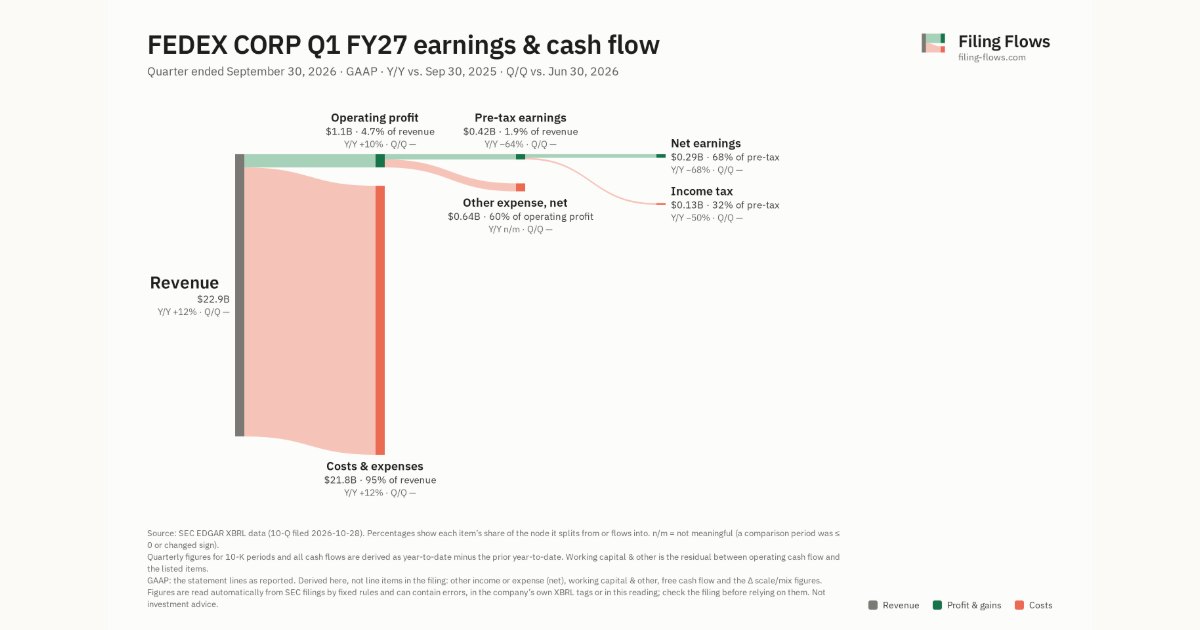
Q1 FY27 Revenue up 12% year over year to $22.9B · 1¢ of every $1 of revenue kept as net profit · operating margin 4.7%
FedEx made $22.9B in Q1 FY27 (+12% Y/Y). Operating margin 4.7%, net earnings $290M. See where every dollar goes — costs, profit and cash — as a Sankey from the 10-Q filed Oct 28, 2026.
Drawing the Sankey…
Open the interactive Sankey → click any line for what the company wrote about it, compare Y/Y and Q/Q, export as PNG or PDF
What changed this quarter
Revenue was $22.9B in Q1 FY27, up 12% year over year.
Operating profit was $1.1B, a 4.7% margin (down 0.1 points year over year). Of the extra revenue versus a year earlier, 4% reached operating profit, below the 5% margin then. Total costs grew 12% against revenue growth of 12%. Net earnings were $0.29B, down 68% year over year. The effective tax rate was 31.6%.
Quarterly history
| Quarter | Form | Filed | Revenue | Y/Y | Op. margin | Net earnings | Op. cash flow |
|---|---|---|---|---|---|---|---|
| Q1 FY27 | 10-Q | Oct 28, 2026 | $22.9B | +12% | 4.7% | $290M | — |
| Q4 FY26 | 10-K | Jul 20, 2026 | $25.0B | +12% | 6.2% | $1.6B | $3.3B |
| Q3 FY26 | 10-Q | Mar 19, 2026 | $24.0B | +8% | 5.6% | $1.1B | $2.0B |
| Q2 FY26 | 10-Q | Dec 18, 2025 | $23.5B | +7% | 5.9% | $956M | $2.0B |
| Q1 FY26 | 10-Q | Sep 18, 2025 | $22.2B | +3% | 5.3% | $824M | $1.7B |
| Q4 FY25 | 10-K | Jul 21, 2025 | $22.2B | +0.5% | 8.1% | $1.6B | $2.5B |
| Q3 FY25 | 10-Q | Mar 20, 2025 | $22.2B | +2% | 5.8% | $909M | $2.0B |
Charts
Interactive views
The same charts as the app — open one to draw it.
💵Where each $1 goesinteractive
Loading the interactive chart…
🌏Named in Asian annual reportsinteractive
Loading the interactive chart…
🔄Rotation against the market and its industry (RRG)interactive
Loading the interactive chart…
🔍Earnings qualityinteractive
Loading the interactive chart…
⚖️Fair value by methodinteractive
Loading the interactive chart…
🔭Outlook & guidanceinteractive
Loading the interactive chart…
📈Investments: gains and what it boughtinteractive
Loading the interactive chart…
🏭Its industry’s money flow (input-output)interactive
Loading the interactive chart…
Customers and suppliers named in filings
Sells to
- BTOC — 12% of its revenue · Stated in 10-K (sentence) · source
- ETS · Stated in 10-K (named, share not stated) · source
- W · Stated in 10-K (named, share not stated) · source
- ACVA · Stated in 10-K (named, share not stated) · source
- PEW · Stated in 10-K (named, share not stated) · source
- AIRT · Stated in 10-K (named, share not stated) · source
Buys from
About FedEx
FedEx Corporation (“FedEx”) was incorporated in Delaware on October 2, 1997 to serve as the parent holding company and provide strategic direction to the FedEx portfolio of companies. FedEx provides customers and businesses worldwide with a broad portfolio of transportation, e-commerce, and business services, offering integrated business solutions utilizing its flexible, efficient, and intelligent global network. Our website is located at fedex.com. Detailed information about our services, solutions, and corporate responsibility initiatives can be found on our website. In addition, we make our Annual Reports on Form 10-K, Quarterly Reports on Form 10-Q, Current Reports on Form 8-K, and all exhibits and amendments to such reports available, free of charge, through our website, as soon as reasonably practicable on the day they are filed with or furnished to the SEC.
In its own words, from its 10-K, filed Jul 20, 2026.
FedEx against its Air Courier Services peers
The largest companies of the same SEC industry, each at its latest quarter. Revenue growth: +12% against the peers' median +12%. Operating margin: 4.7% against the peers' median 4.7%.
| Company | Quarter | Revenue | Y/Y | Op. margin |
|---|---|---|---|---|
| FDX FedEx | Q1 FY27 | $22.9B | +12% | 4.7% |
| FDXF FedEx Freight Holding Company | Q1 FY27 | $2.4B | +8% | 10.4% |
| AIRT Air T | Q1 FY27 | $115M | +63% | -11.1% |
Source: FedEx 10-Q on SEC EDGAR · CIK 1048911 · Air Courier Services
Guidance and outlook
13F: who owns FDX and who is buying
More on FDX
- How FedEx makes money: revenue by segment
- FedEx next earnings date and what analysts expect
- FedEx stock forecast, price target and fair value
- Who owns FedEx stock: holders, funds and Congress trades
- FedEx guidance and outlook
- Is FedEx a takeover target? LBO and rumors
- FedEx recalls, complaints and regulation
History
Every quarter: Q1 FY27 results · Q4 FY26 results · Q3 FY26 results · Q2 FY26 results · Q1 FY26 results · Q4 FY25 results · Q3 FY25 results