Filing Flows › Consumer Discretionary › CDW (CDW)
CDW (CDW) earnings and revenue breakdown
Latest: Q3 2026 · 10-Q filed Nov 4, 2026 · CDW (CDW) Q3 2026 earnings results →
Q3 2026 Revenue up 18% year over year to $6.8B · 5¢ of every $1 of revenue kept as net profit · operating margin 7.2%
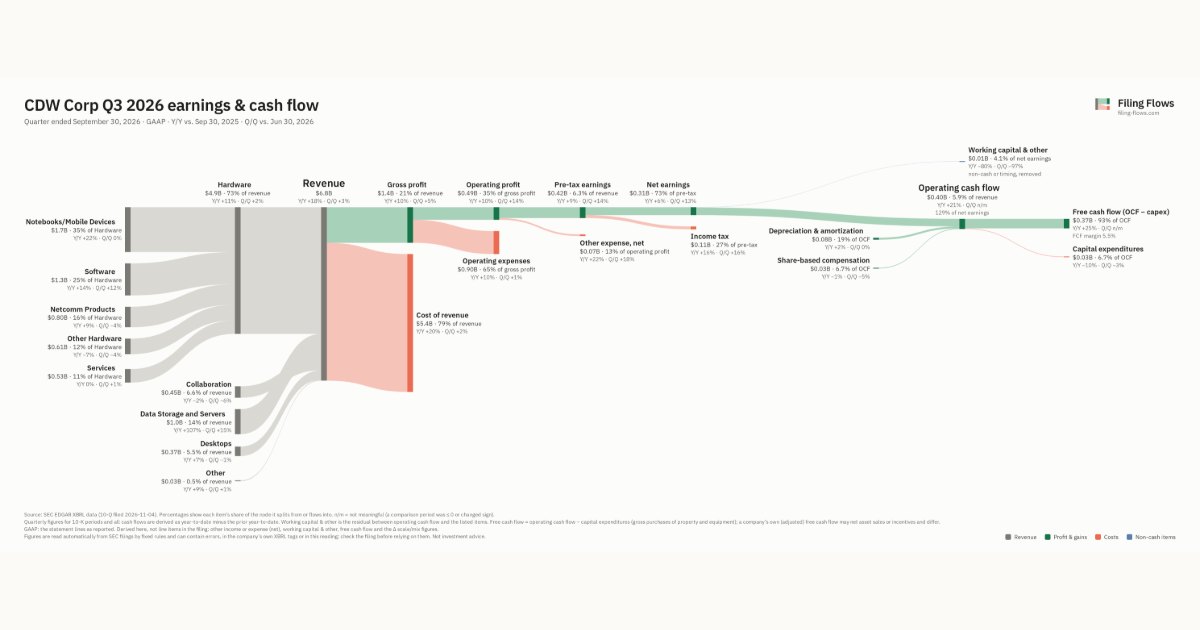
CDW made $6.8B in Q3 2026 (+18% Y/Y): Hardware $4.9B, Data Storage and Servers $975M, Collaboration $446M. Operating margin 7.2%, net earnings $310M. See where every dollar goes — costs, profit and cash — as a Sankey from the 10-Q filed Nov 4, 2026.
Drawing the Sankey…
Open the interactive Sankey → click any line for what the company wrote about it, compare Y/Y and Q/Q, export as PNG or PDF
What changed this quarter
Revenue was $6.8B in Q3 2026, up 18% year over year and up 3% from the previous quarter. Notebooks/Mobile Devices was the largest line at 26% of revenue. Data Storage and Servers added $0.51B year over year (up 107%), 50% of the total change. Other Hardware declined 7%.
Gross margin was 20.5%, down 1.4 points from Q3 2025. Operating profit was $0.49B, a 7.2% margin (down 0.5 points year over year). Of the extra revenue versus Q3 2025, 5% reached operating profit, below the 8% margin then. Operating expenses grew 10% against revenue growth of 18%. Net earnings were $0.31B, up 6% year over year. The effective tax rate was 26.9%.
Operating cash flow was $0.40B (up 21% year over year), 129% of net earnings. Non-cash charges added back $0.08B of depreciation and amortization and $0.03B of share-based compensation. Capital expenditures of $0.03B left free cash flow of $0.37B.
Quarterly history
| Quarter | Form | Filed | Revenue | Y/Y | Op. margin | Net earnings | Op. cash flow |
|---|---|---|---|---|---|---|---|
| Q3 2026 | 10-Q | Nov 4, 2026 | $6.8B | +18% | 7.2% | $310M | $399M |
| Q2 2026 | 10-Q | Aug 5, 2026 | $6.6B | +10% | 6.5% | $274M | −$55.1M |
| Q1 2026 | 10-Q | May 6, 2026 | $5.7B | +9% | 6.6% | $235M | $275M |
| Q4 2025 | 10-K | Feb 20, 2026 | $5.5B | +6% | 7.8% | $280M | $434M |
| Q3 2025 | 10-Q | Nov 4, 2025 | $5.7B | +4% | 7.7% | $291M | $328M |
| Q2 2025 | 10-Q | Aug 6, 2025 | $6.0B | +10% | 7.0% | $271M | $156M |
| Q1 2025 | 10-Q | May 7, 2025 | $5.2B | +7% | 7.0% | $225M | $287M |
Charts
Interactive views
The same charts as the app — open one to draw it.
💵Where each $1 goesinteractive
Loading the interactive chart…
🌏Named in Asian annual reportsinteractive
Loading the interactive chart…
🔄Rotation against the market and its industry (RRG)interactive
Loading the interactive chart…
🔍Earnings qualityinteractive
Loading the interactive chart…
⚖️Fair value by methodinteractive
Loading the interactive chart…
🔭Outlook & guidanceinteractive
Loading the interactive chart…
📈Investments: gains and what it boughtinteractive
Loading the interactive chart…
🏭Its industry’s money flow (input-output)interactive
Loading the interactive chart…
Customers and suppliers named in filings
Buys from
- INGM · Stated in 10-K (named, share not stated) · source
- SNX · Stated in 10-K (named, share not stated) · source
About CDW
CDW Corporation (together with its subsidiaries, the “Company,” “CDW”, “we”, “us”, or “our”), a Fortune 500 company and member of the S&P 500 Index, is a leading multi-brand provider of information technology (“IT”) solutions to business, government, education, and healthcare customers in the United States (“US”), the United Kingdom (“UK”), and Canada. Our broad array of offerings ranges from discrete hardware and software products to integrated IT solutions and services that include on-premise and cloud capabilities across hybrid infrastructure, digital experience, and security.
In its own words, from its 10-K, filed Feb 20, 2026.
CDW against its Retail-Catalog & Mail-Order Houses peers
The largest companies of the same SEC industry, each at its latest quarter. Revenue growth: +18% against the peers' median +10%. Operating margin: 7.2% against the peers' median 3.1%.
| Company | Quarter | Revenue | Y/Y | Op. margin |
|---|---|---|---|---|
| CDW CDW | Q3 2026 | $6.8B | +18% | 7.2% |
| AMZN Amazon.com | Q3 2026 | $201.9B | +12% | 13.9% |
| CPNG Coupang | Q3 2026 | $10.0B | +8% | -4.5% |
| W Wayfair | Q3 2026 | $3.4B | +10% | 3.1% |
| CHWY Chewy | Q2 FY27 | $3.3B | +7% | 2.8% |
| NSIT Insight Enterprises | Q3 2026 | $2.4B | +22% | 2.8% |
| Old QVC Group | Q2 2026 | $2.0B | -11% | 2.6% |
| QVCG QVC Group | Q2 2026 | $1.8B | -11% | 3.5% |
| PTRN Pattern Group | Q3 2026 | $886M | +38% | 4.2% |
Source: CDW 10-Q on SEC EDGAR · CIK 1402057 · Retail-Catalog & Mail-Order Houses
Guidance and outlook
13F: who owns CDW and who is buying
More on CDW
History
Every quarter: Q3 2026 results · Q2 2026 results · Q1 2026 results · Q4 2025 results · Q3 2025 results · Q2 2025 results · Q1 2025 results