Filing Flows › Consumer Discretionary › Amazon.com (AMZN)
Amazon.com (AMZN) earnings and revenue breakdown
Latest: Q3 2026 · 10-Q filed Oct 30, 2026 · Amazon.com (AMZN) Q3 2026 earnings results →
Q3 2026 Revenue up 12% year over year to $201.9B · 10¢ of every $1 of revenue kept as net profit · operating margin 13.9%
Amazon.com made $201.9B in Q3 2026 (+12% Y/Y): Online stores $68.5B, Third-party seller services $46.5B, AWS $46.0B. Operating margin 13.9%, net earnings $20.7B. See where every dollar goes — costs, profit and cash — as a Sankey from the 10-Q filed Oct 30, 2026.
Drawing the Sankey…
Open the interactive Sankey → click any line for what the company wrote about it, compare Y/Y and Q/Q, export as PNG or PDF
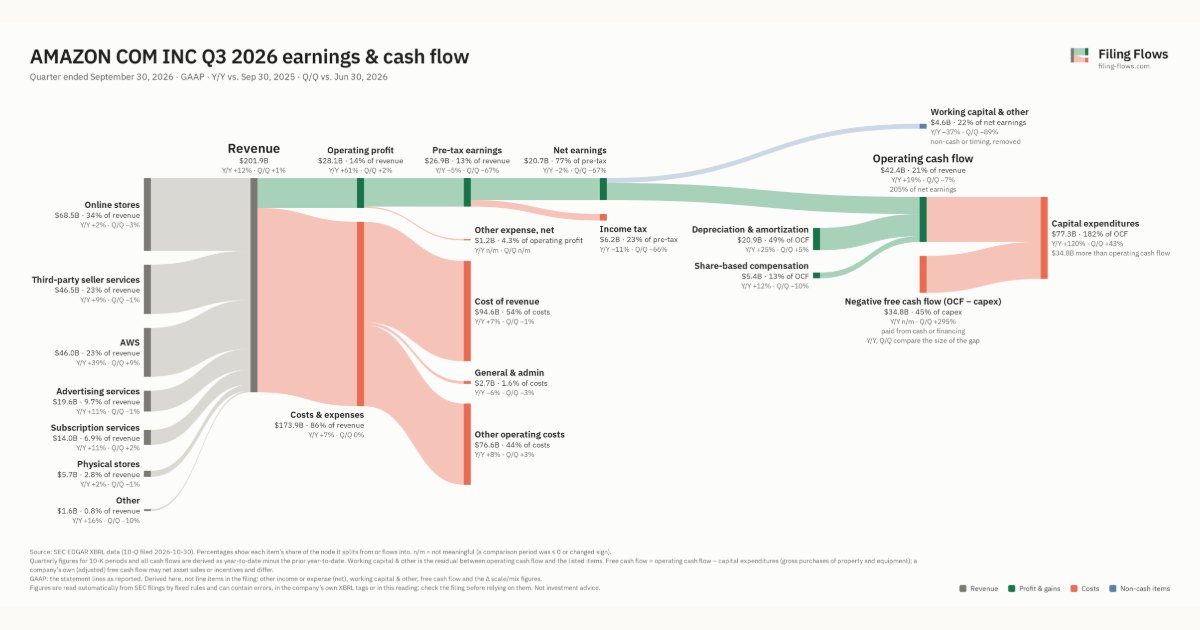
What changed this quarter
Revenue was $201.9B in Q3 2026, up 12% year over year and up 1% from the previous quarter. Online stores was the largest line at 34% of revenue. AWS added $13.0B year over year (up 39%), 60% of the total change.
Operating profit was $28.1B, a 13.9% margin (up 4.2 points year over year). Of the extra revenue versus Q3 2025, 49% reached operating profit, above the 10% margin then. Total costs grew 7% against revenue growth of 12%. Net earnings were $20.7B, down 2% year over year. The effective tax rate was 23.0%.
Operating cash flow was $42.4B (up 19% year over year), 205% of net earnings. Non-cash charges added back $20.9B of depreciation and amortization and $5.4B of share-based compensation. Working capital and other items used $4.6B. Capital expenditures of $77.3B exceeded it, leaving free cash flow of −$34.8B.
Quarterly history
| Quarter | Form | Filed | Revenue | Y/Y | Op. margin | Net earnings | Op. cash flow |
|---|---|---|---|---|---|---|---|
| Q3 2026 | 10-Q | Oct 30, 2026 | $201.9B | +12% | 13.9% | $20.7B | $42.4B |
| Q2 2026 | 10-Q | Jul 31, 2026 | $200.6B | +20% | 13.7% | $62.6B | $45.4B |
| Q1 2026 | 10-Q | Apr 30, 2026 | $181.5B | +17% | 13.1% | $30.3B | $26.0B |
| Q4 2025 | 10-K | Feb 6, 2026 | $213.4B | +14% | 11.7% | $21.2B | $54.5B |
| Q3 2025 | 10-Q | Oct 31, 2025 | $180.2B | +13% | 9.7% | $21.2B | $35.5B |
| Q2 2025 | 10-Q | Aug 1, 2025 | $167.7B | +13% | 11.4% | $18.2B | $32.5B |
| Q1 2025 | 10-Q | May 2, 2025 | $155.7B | +9% | 11.8% | $17.1B | $17.0B |
Charts
In supply chains and themes
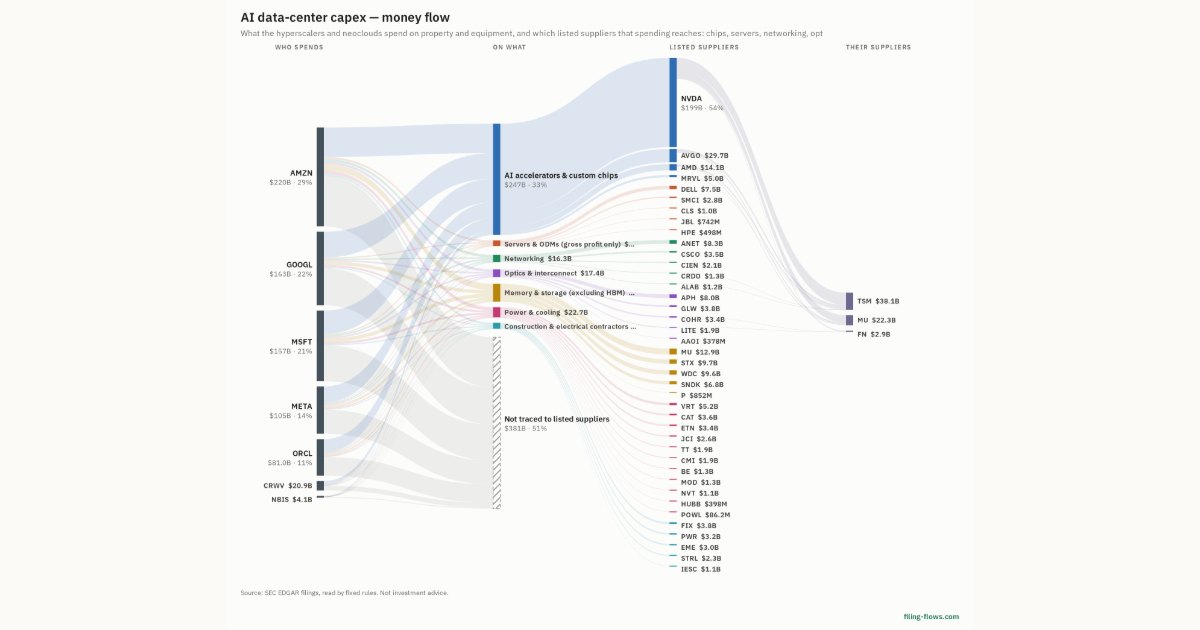
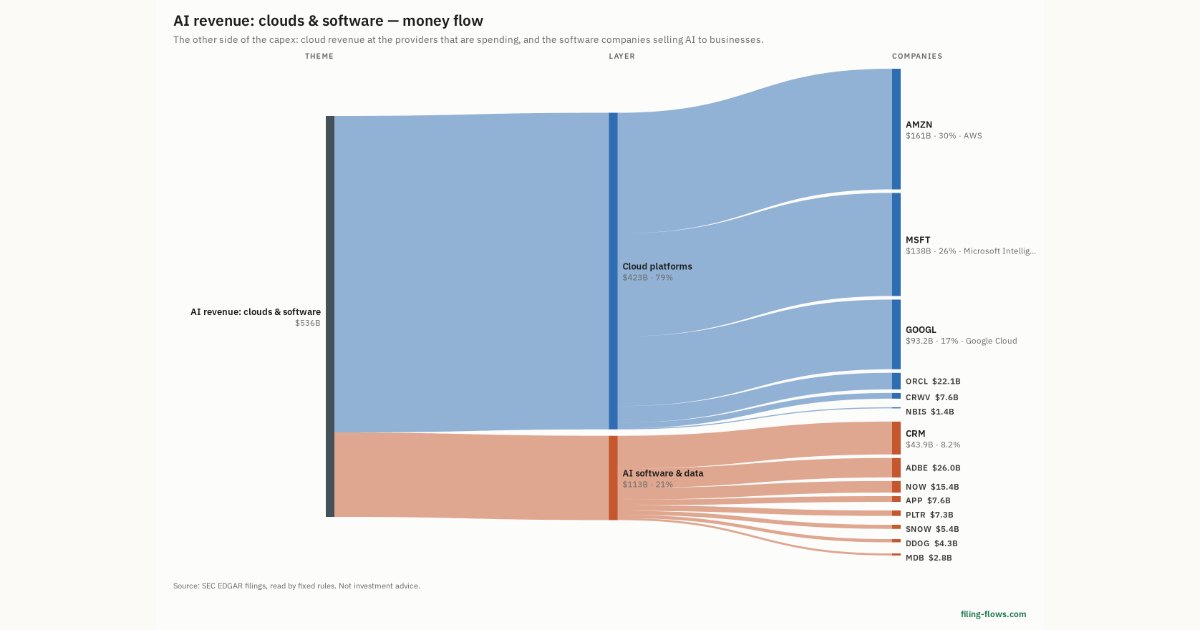
Interactive views
The same charts as the app — open one to draw it.
💵Where each $1 goesinteractive
Loading the interactive chart…
🌏Named in Asian annual reportsinteractive
Loading the interactive chart…
🔄Rotation against the market and its industry (RRG)interactive
Loading the interactive chart…
🔍Earnings qualityinteractive
Loading the interactive chart…
⚖️Fair value by methodinteractive
Loading the interactive chart…
🔭Outlook & guidanceinteractive
Loading the interactive chart…
📈Investments: gains and what it boughtinteractive
Loading the interactive chart…
🏭Its industry’s money flow (input-output)interactive
Loading the interactive chart…
Customers and suppliers named in filings
Sells to
- LQDT — 20% of its revenue · Stated in 10-K (sentence) · source
- AIRE · Stated in 10-K (named, share not stated) · source
- ALKT · Stated in 10-K (named, share not stated) · source
- VEEV · Stated in 10-K (named, share not stated) · source
- MYPS · Stated in 10-K (named, share not stated) · source
- OKTA · Stated in 10-K (named, share not stated) · source
- NCNO · Stated in 10-K (named, share not stated) · source
- PLTR · Stated in 10-K (named, share not stated) · source
- SAIL · Stated in 10-K (named, share not stated) · source
- DUOL · Stated in 10-K (named, share not stated) · source
- RBLX · Stated in 10-K (named, share not stated) · source
- YOU · Stated in 10-K (named, share not stated) · source
Buys from
- PTRN — 93% of the supplier’s revenue · Stated in 10-K (sentence) · source
- MYSZ — 81% of the supplier’s revenue · Stated in 10-K (sentence) · source
- SDEV — 73% of the supplier’s revenue · Stated in 10-K (sentence) · source
- HNST — 39% of the supplier’s revenue · Stated in 10-K (sentence) · source
- IPW — 38% of the supplier’s revenue · Stated in 10-K (sentence) · source
- LUVU — 36% of the supplier’s revenue · Stated in 10-K (sentence) · source
- NXPL — 31% of the supplier’s revenue · Stated in 10-K (sentence) · source
- ATER — 31% of the supplier’s revenue · Stated in 10-K (sentence) · source
- CRSR — 31% of the supplier’s revenue · Stated in 10-K (sentence) · source
- STRZ — 30% of the supplier’s revenue · Stated in 10-K (sentence) · source
- BZFD — 28% of the supplier’s revenue · Stated in 10-K (sentence) · source
- KOSS — 22% of the supplier’s revenue · Stated in 10-K (sentence) · source
About Amazon.com
Amazon is guided by four principles: customer obsession rather than competitor focus, passion for invention, commitment to operational excellence, and long-term thinking. Amazon strives to be Earth’s Most Customer-Centric Company, Earth’s Best Employer, and Earth’s Safest Place to Work. Customer reviews, 1-Click shopping, personalized recommendations, Prime, Fulfillment by Amazon, AWS, Kindle Direct Publishing, Kindle, Career Choice, Fire tablets, Fire TV, Amazon Echo, Alexa, Just Walk Out technology, Amazon Studios, and The Climate Pledge are some of the things pioneered by Amazon. For more information, visit amazon.com/about and follow @AmazonNews.
In its own words, from its 8-K, filed Jul 30, 2026.
Amazon.com against its Retail-Catalog & Mail-Order Houses peers
The largest companies of the same SEC industry, each at its latest quarter. Revenue growth: +12% against the peers' median +10%. Operating margin: 13.9% against the peers' median 3.1%.
| Company | Quarter | Revenue | Y/Y | Op. margin |
|---|---|---|---|---|
| AMZN Amazon.com | Q3 2026 | $201.9B | +12% | 13.9% |
| CPNG Coupang | Q3 2026 | $10.0B | +8% | -4.5% |
| CDW CDW | Q3 2026 | $6.8B | +18% | 7.2% |
| W Wayfair | Q3 2026 | $3.4B | +10% | 3.1% |
| CHWY Chewy | Q2 FY27 | $3.3B | +7% | 2.8% |
| NSIT Insight Enterprises | Q3 2026 | $2.4B | +22% | 2.8% |
| Old QVC Group | Q2 2026 | $2.0B | -11% | 2.6% |
| QVCG QVC Group | Q2 2026 | $1.8B | -11% | 3.5% |
| PTRN Pattern Group | Q3 2026 | $886M | +38% | 4.2% |
Source: Amazon.com 10-Q on SEC EDGAR · CIK 1018724 · Retail-Catalog & Mail-Order Houses
Guidance and outlook
13F: who owns AMZN and who is buying
More on AMZN
- How Amazon.com makes money: revenue by segment
- Amazon.com next earnings date and what analysts expect
- Amazon.com stock forecast, price target and fair value
- Who owns Amazon.com stock: holders, funds and Congress trades
- Amazon.com guidance and outlook
- Is Amazon.com a takeover target? LBO and rumors
- Amazon.com recalls, complaints and regulation
History
Every quarter: Q3 2026 results · Q2 2026 results · Q1 2026 results · Q4 2025 results · Q3 2025 results · Q2 2025 results · Q1 2025 results
- Amazon.com guidance history: guided vs reported
- Amazon.com operating margin by quarter
- Amazon.com net income by quarter
- Amazon.com free cash flow by quarter
- Amazon.com capital expenditures by quarter
- Amazon.com Online stores revenue by quarter
- Amazon.com Third-party seller services revenue by quarter
- Amazon.com AWS revenue by quarter