Filing Flows › Technology › Hewlett Packard Enterprise (HPE)
Hewlett Packard Enterprise (HPE) earnings and revenue breakdown
Latest: Q3 FY26 · 10-Q filed Sep 3, 2026 · Hewlett Packard Enterprise (HPE) Q3 FY26 earnings results →
Q3 FY26 Revenue up 34% year over year to $12.2B · 13¢ of every $1 of revenue kept as net profit · operating margin 11.4%
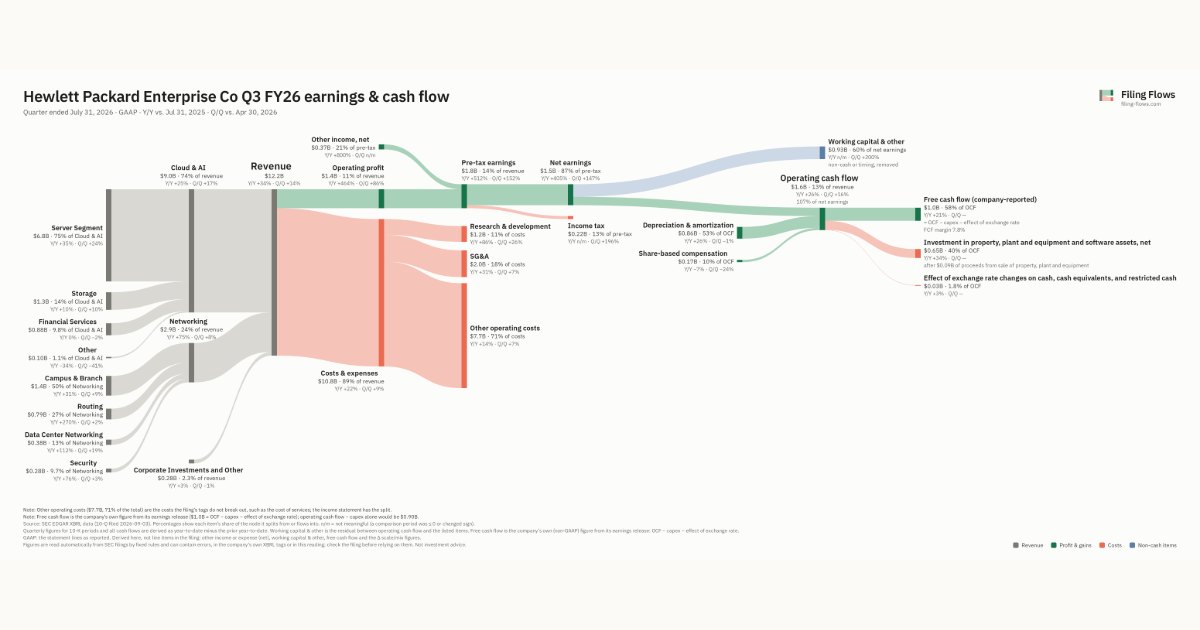
Hewlett Packard Enterprise made $12.2B in Q3 FY26 (+34% Y/Y): Cloud & AI $9.0B, Networking $2.9B, Corporate Investments and Other $278M. Operating margin 11.4%, net earnings $1.5B. See where every dollar goes — costs, profit and cash — as a Sankey from the 10-Q filed Sep 3, 2026.
Drawing the Sankey…
Open the interactive Sankey → click any line for what the company wrote about it, compare Y/Y and Q/Q, export as PNG or PDF
What changed this quarter
Revenue was $12.2B in Q3 FY26, up 34% year over year and up 14% from the previous quarter. Server Segment was the largest line at 55% of revenue. Server Segment added $1.8B year over year (up 35%), 57% of the total change. Other declined 34%.
Operating profit was $1.4B, a 11.4% margin (up 8.7 points year over year). Of the extra revenue versus Q3 FY25, 37% reached operating profit, above the 3% margin then. Total costs grew 22% against revenue growth of 34%. The fastest-growing cost line was Research & development (+86%). Net earnings were $1.5B, up 405% year over year. The effective tax rate was 12.6%. Non-operating items added $0.37B, 21% of pre-tax earnings, so the bottom line overstates operating performance.
Operating cash flow was $1.6B (up 26% year over year), 107% of net earnings. Non-cash charges added back $0.86B of depreciation and amortization and $0.17B of share-based compensation. Working capital and other items used $0.93B. After investment in property, plant and equipment and software assets, net ($0.65B) and effect of exchange rate changes on cash, cash equivalents, and restricted cash ($0.03B), free cash flow as the company reports it was $1.0B.
Quarterly history
| Quarter | Form | Filed | Revenue | Y/Y | Op. margin | Net earnings | Op. cash flow |
|---|---|---|---|---|---|---|---|
| Q3 FY26 | 10-Q | Sep 3, 2026 | $12.2B | +34% | 11.4% | $1.5B | $1.6B |
| Q2 FY26 | 10-Q | Jun 2, 2026 | $10.7B | +40% | 7.0% | $624M | $1.4B |
| Q1 FY26 | 10-Q | Mar 10, 2026 | $9.3B | +18% | 5.1% | $452M | $1.2B |
| Q4 FY25 | 10-K | Dec 18, 2025 | $9.7B | +14% | -0.1% | $175M | $2.5B |
| Q3 FY25 | 10-Q | Sep 4, 2025 | $9.1B | +18% | 2.7% | $305M | $1.3B |
| Q2 FY25 | 10-Q | Jun 4, 2025 | $7.6B | +6% | -14.5% | −$1.1B | −$461M |
| Q4 FY24 | 10-K | Dec 19, 2024 | $8.5B | +15% | 8.2% | $1.4B | $2.0B |
Charts
In supply chains and themes
Interactive views
The same charts as the app — open one to draw it.
💵Where each $1 goesinteractive
Loading the interactive chart…
🌏Named in Asian annual reportsinteractive
Loading the interactive chart…
🔄Rotation against the market and its industry (RRG)interactive
Loading the interactive chart…
🔍Earnings qualityinteractive
Loading the interactive chart…
⚖️Fair value by methodinteractive
Loading the interactive chart…
🔭Outlook & guidanceinteractive
Loading the interactive chart…
📈Investments: gains and what it boughtinteractive
Loading the interactive chart…
🏭Its industry’s money flow (input-output)interactive
Loading the interactive chart…
Customers and suppliers named in filings
Buys from
About Hewlett Packard Enterprise
Hewlett Packard Enterprise is a global technology leader focused on developing intelligent solutions that allow customers to capture, analyze and act upon data seamlessly from edge to cloud. We enable our customers to accelerate business outcomes by driving new business models, creating new customer and employee experiences, and increasing operational efficiency today and into the future. Our customers range from small-and-medium-sized businesses to large global enterprises and governmental entities. Our legacy dates back to a partnership founded in 1939 by William R. Hewlett and David Packard, and we strive every day to uphold and enhance that legacy through our dedication to providing innovative technological solutions to our customers.
In its own words, from its 10-K, filed Dec 18, 2025.
Hewlett Packard Enterprise against its Computer & office Equipment peers
The largest companies of the same SEC industry, each at its latest quarter. Revenue growth: +34% against the peers' median +12%. Operating margin: 11.4% against the peers' median 11.4%.
| Company | Quarter | Revenue | Y/Y | Op. margin |
|---|---|---|---|---|
| HPE Hewlett Packard Enterprise | Q3 FY26 | $12.2B | +34% | 11.4% |
| IBM International Business Machines | Q3 2026 | $17.1B | +5% | 14.5% |
| HPQ HP | Q3 FY26 | $15.7B | +12% | 5.7% |
Source: Hewlett Packard Enterprise 10-Q on SEC EDGAR · CIK 1645590 · Computer & office Equipment
Guidance and outlook
13F: who owns HPE and who is buying
More on HPE
- How Hewlett Packard Enterprise makes money: revenue by segment
- Hewlett Packard Enterprise next earnings date and what analysts expect
- Hewlett Packard Enterprise stock forecast, price target and fair value
- Who owns Hewlett Packard Enterprise stock: holders, funds and Congress trades
- Hewlett Packard Enterprise guidance and outlook
- Is Hewlett Packard Enterprise a takeover target? LBO and rumors
- Hewlett Packard Enterprise recalls, complaints and regulation
History
Every quarter: Q3 FY26 results · Q2 FY26 results · Q1 FY26 results · Q4 FY25 results · Q3 FY25 results · Q2 FY25 results · Q4 FY24 results
- Hewlett Packard Enterprise guidance history: guided vs reported
- Hewlett Packard Enterprise operating margin by quarter
- Hewlett Packard Enterprise net income by quarter
- Hewlett Packard Enterprise free cash flow by quarter
- Hewlett Packard Enterprise R&D spending by quarter
- Hewlett Packard Enterprise capital expenditures by quarter
- Hewlett Packard Enterprise Cloud & AI revenue by quarter
- Hewlett Packard Enterprise Corporate Investments and Other revenue by quarter