Filing Flows › Technology › International Business Machines (IBM)
International Business Machines (IBM) earnings and revenue breakdown
Latest: Q3 2026 · 10-Q filed Oct 22, 2026 · International Business Machines (IBM) Q3 2026 earnings results →
Q3 2026 Revenue up 5% year over year to $17.1B · 13¢ of every $1 of revenue kept as net profit · operating margin 14.5%
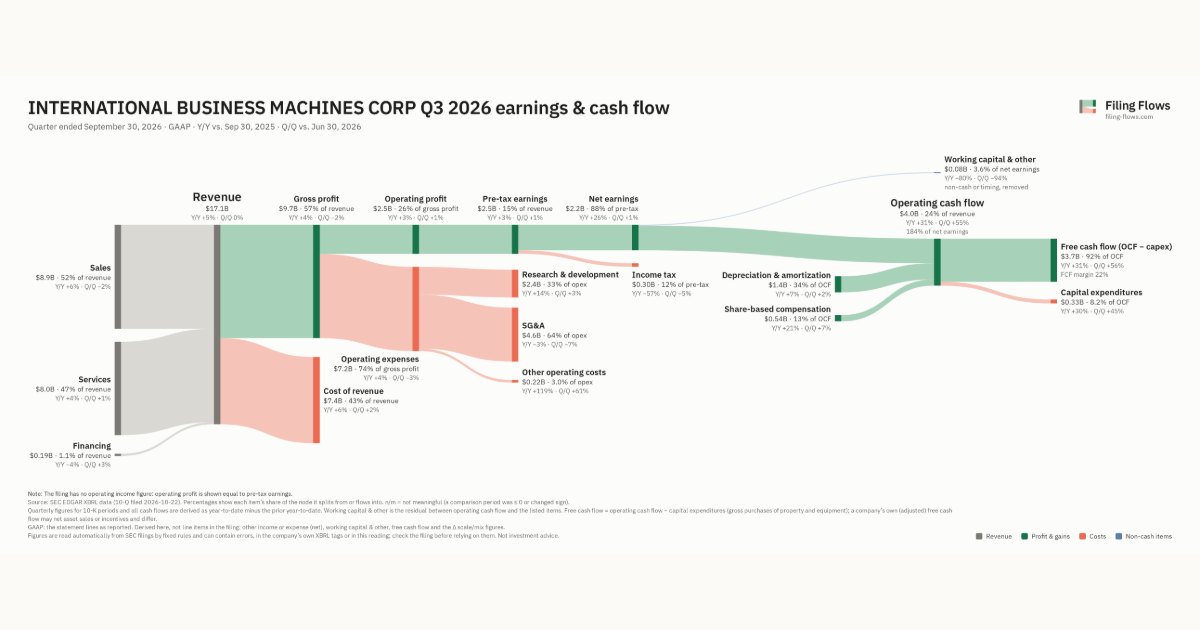
International Business Machines made $17.1B in Q3 2026 (+5% Y/Y): Sales $8.9B, Services $8.0B, Financing $192M. Operating margin 14.5%, net earnings $2.2B. See where every dollar goes — costs, profit and cash — as a Sankey from the 10-Q filed Oct 22, 2026.
Drawing the Sankey…
Open the interactive Sankey → click any line for what the company wrote about it, compare Y/Y and Q/Q, export as PNG or PDF
What changed this quarter
Revenue was $17.1B in Q3 2026, up 5% year over year and roughly flat from the previous quarter. Sales was the largest line at 52% of revenue. Sales added $0.51B year over year (up 6%), 65% of the total change. Financing declined 4%.
Gross margin was 56.8%, down 0.5 points from Q3 2025. Operating profit was $2.5B, a 14.5% margin (down 0.3 points year over year). Of the extra revenue versus Q3 2025, 8% reached operating profit, below the 15% margin then. Operating expenses grew 4% against revenue growth of 5%. The fastest-growing cost line was Other operating costs (+128%). Net earnings were $2.2B, up 26% year over year. The effective tax rate was 12.0%.
Operating cash flow was $4.0B (up 31% year over year), 184% of net earnings. Non-cash charges added back $1.4B of depreciation and amortization and $0.54B of share-based compensation. Capital expenditures of $0.33B left free cash flow of $3.7B.
Quarterly history
| Quarter | Form | Filed | Revenue | Y/Y | Op. margin | Net earnings | Op. cash flow |
|---|---|---|---|---|---|---|---|
| Q3 2026 | 10-Q | Oct 22, 2026 | $17.1B | +5% | 14.5% | $2.2B | $4.0B |
| Q2 2026 | 10-Q | Jul 23, 2026 | $17.2B | +1% | 14.4% | $2.2B | $2.6B |
| Q1 2026 | 10-Q | Apr 23, 2026 | $15.9B | +10% | 8.7% | $1.2B | $5.2B |
| Q4 2025 | 10-K | Feb 24, 2026 | $19.7B | +12% | 21.2% | $5.6B | $4.0B |
| Q3 2025 | 10-Q | Oct 23, 2025 | $16.3B | +9% | 14.9% | $1.7B | $3.1B |
| Q2 2025 | 10-Q | Jul 24, 2025 | $17.0B | +8% | 15.3% | $2.2B | $1.7B |
| Q1 2025 | 10-Q | Apr 24, 2025 | $14.5B | +0.5% | 8.0% | $1.1B | $4.4B |
Charts
Interactive views
The same charts as the app — open one to draw it.
💵Where each $1 goesinteractive
Loading the interactive chart…
🌏Named in Asian annual reportsinteractive
Loading the interactive chart…
🔄Rotation against the market and its industry (RRG)interactive
Loading the interactive chart…
🔍Earnings qualityinteractive
Loading the interactive chart…
⚖️Fair value by methodinteractive
Loading the interactive chart…
🔭Outlook & guidanceinteractive
Loading the interactive chart…
📈Investments: gains and what it boughtinteractive
Loading the interactive chart…
🏭Its industry’s money flow (input-output)interactive
Loading the interactive chart…
Customers and suppliers named in filings
Sells to
- DOCN · Stated in 10-K (named, share not stated) · source
- DVLT · Stated in 10-K (named, share not stated) · source
About International Business Machines
International Business Machines Corporation (IBM or the company) was incorporated in the State of New York on June 16, 1911, as the Computing-Tabulating-Recording Co. (C-T-R), a consolidation of the Computing Scale Co. of America, the Tabulating Machine Co. and The International Time Recording Co. of New York. Since that time, IBM has focused on the intersection of business insight and technological innovation, and its operations and aims have been international in nature. This was signaled over 100 years ago, in 1924, when C-T-R changed its name to International Business Machines Corporation. And it continues today—we create sustained value for clients by helping them leverage the power of hybrid cloud and artificial intelligence (AI).
In its own words, from its 10-K, filed Feb 24, 2026.
International Business Machines against its Computer & office Equipment peers
The largest companies of the same SEC industry, each at its latest quarter. Revenue growth: +5% against the peers' median +12%. Operating margin: 14.5% against the peers' median 11.4%.
| Company | Quarter | Revenue | Y/Y | Op. margin |
|---|---|---|---|---|
| IBM International Business Machines | Q3 2026 | $17.1B | +5% | 14.5% |
| HPQ HP | Q3 FY26 | $15.7B | +12% | 5.7% |
| HPE Hewlett Packard Enterprise | Q3 FY26 | $12.2B | +34% | 11.4% |
Source: International Business Machines 10-Q on SEC EDGAR · CIK 51143 · Computer & office Equipment
13F: who owns IBM and who is buying
More on IBM
- How International Business Machines makes money: revenue by segment
- International Business Machines stock forecast, price target and fair value
- Who owns International Business Machines stock: holders, funds and Congress trades
- International Business Machines guidance and outlook
- International Business Machines recalls, complaints and regulation
History
Every quarter: Q3 2026 results · Q2 2026 results · Q1 2026 results · Q4 2025 results · Q3 2025 results · Q2 2025 results · Q1 2025 results
- International Business Machines guidance history: guided vs reported
- International Business Machines gross margin by quarter
- International Business Machines operating margin by quarter
- International Business Machines net income by quarter
- International Business Machines free cash flow by quarter
- International Business Machines R&D spending by quarter
- International Business Machines capital expenditures by quarter
- International Business Machines Sales revenue by quarter
- International Business Machines Services revenue by quarter
- International Business Machines Financing revenue by quarter