Filing Flows › Health Care › Bausch Health Companies (BHC)
Bausch Health Companies (BHC) earnings and revenue breakdown
Latest: Q3 2026 · 10-Q filed Oct 29, 2026 · Bausch Health Companies (BHC) Q3 2026 earnings results →
Q3 2026 Revenue up 10% year over year to $2.9B · 15¢ of every $1 of revenue kept as net profit · operating margin 33.4%
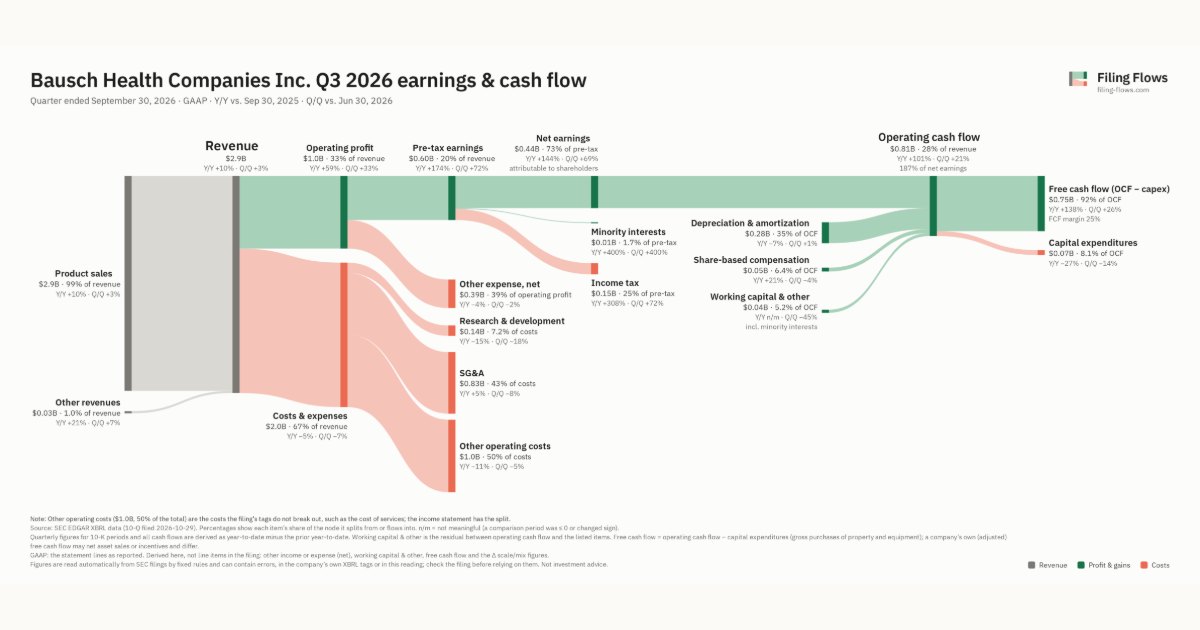
Bausch Health Companies made $2.9B in Q3 2026 (+10% Y/Y): Product sales $2.9B, Other revenues $29.0M. Operating margin 33.4%, net earnings $436M. See where every dollar goes — costs, profit and cash — as a Sankey from the 10-Q filed Oct 29, 2026.
Drawing the Sankey…
Open the interactive Sankey → click any line for what the company wrote about it, compare Y/Y and Q/Q, export as PNG or PDF
What changed this quarter
Revenue was $2.9B in Q3 2026, up 10% year over year and up 3% from the previous quarter. Product sales was the largest line at 99% of revenue. Product sales added $0.26B year over year (up 10%), 98% of the total change.
Operating profit was $1.0B, a 33.4% margin (up 10.3 points year over year). Of the extra revenue versus Q3 2025, 140% reached operating profit, above the 23% margin then. Total costs fell 5% while revenue rose 10%. Net earnings were $0.44B, up 144% year over year. The effective tax rate was 25.3%.
Operating cash flow was $0.81B (up 101% year over year), 183% of net income including minority interests. Non-cash charges added back $0.28B of depreciation and amortization and $0.05B of share-based compensation. Capital expenditures of $0.07B left free cash flow of $0.75B.
Quarterly history
| Quarter | Form | Filed | Revenue | Y/Y | Op. margin | Net earnings | Op. cash flow |
|---|---|---|---|---|---|---|---|
| Q3 2026 | 10-Q | Oct 29, 2026 | $2.9B | +10% | 33.4% | $436M | $814M |
| Q2 2026 | 10-Q | Jul 30, 2026 | $2.9B | +13% | 25.9% | $258M | $670M |
| Q1 2026 | 10-Q | Apr 30, 2026 | $2.5B | +12% | -37.6% | −$1.4B | $230M |
| Q4 2025 | 10-K | Feb 19, 2026 | $2.8B | +9% | 17.0% | −$103M | $495M |
| Q3 2025 | 10-Q | Oct 30, 2025 | $2.7B | +7% | 23.1% | $179M | $405M |
| Q2 2025 | 10-Q | Jul 31, 2025 | $2.5B | +5% | 17.5% | $148M | $289M |
| Q1 2025 | 10-Q | May 1, 2025 | $2.3B | +5% | 12.2% | −$86.0M | $211M |
Charts
Interactive views
The same charts as the app — open one to draw it.
💵Where each $1 goesinteractive
Loading the interactive chart…
🌏Named in Asian annual reportsinteractive
Loading the interactive chart…
🔄Rotation against the market and its industry (RRG)interactive
Loading the interactive chart…
🔍Earnings qualityinteractive
Loading the interactive chart…
⚖️Fair value by methodinteractive
Loading the interactive chart…
🔭Outlook & guidanceinteractive
Loading the interactive chart…
📈Investments: gains and what it boughtinteractive
Loading the interactive chart…
🏭Its industry’s money flow (input-output)interactive
Loading the interactive chart…
Customers and suppliers named in filings
Sells to
- COR — 18% of its revenue · Stated in 10-K (customer table) · source
- MCK — 16% of its revenue · Stated in 10-K (customer table) · source
- CAH — 14% of its revenue · Stated in 10-K (customer table) · source
About Bausch Health Companies
Bausch Health Companies Inc. (“we”, “us”, “our”, the “Company” or “Bausch Health”) is a global, diversified specialty pharmaceutical and medical device company that develops, manufactures and markets, primarily in the therapeutic areas of gastroenterology (“GI”), hepatology, neurology and dermatology, a broad range of branded, generic and branded generic pharmaceuticals, over-the-counter (“OTC”) products and aesthetic medical devices and, through our approximately 88% ownership of Bausch + Lomb Corporation (“Bausch + Lomb” or “B+L”), branded, and branded generic pharmaceuticals, OTC products and medical devices (contact lenses, intraocular lenses, ophthalmic surgical equipment) in the therapeutic areas of eye health. The Company’s products are marketed directly or indirectly in approximately 90 countries.
In its own words, from its 10-K, filed Feb 19, 2026.
Bausch Health Companies against its Pharmaceutical Preparations peers
The largest companies of the same SEC industry, each at its latest quarter. Revenue growth: +10% against the peers' median +10%. Operating margin: 33.4% against the peers' median 30.7%.
| Company | Quarter | Revenue | Y/Y | Op. margin |
|---|---|---|---|---|
| BHC Bausch Health Companies | Q3 2026 | $2.9B | +10% | 33.4% |
| JNJ Johnson & Johnson | Q3 2026 | $25.4B | +6% | 0.1% |
| LLY ELI Lilly | Q3 2026 | $24.4B | +39% | 34.5% |
| MRK Merck | Q3 2026 | $18.1B | +5% | 30.7% |
| ABBV AbbVie | Q3 2026 | $17.4B | +10% | 36.0% |
| PFE Pfizer | Q3 2026 | $16.6B | -0.4% | 20.4% |
| BMY Bristol Myers Squibb | Q3 2026 | $13.1B | +7% | 19.4% |
| ABT Abbott Laboratories | Q3 2026 | $13.0B | +14% | 10.4% |
| REGN Regeneron Pharmaceuticals | Q3 2026 | $5.1B | +36% | 40.0% |
Source: Bausch Health Companies 10-Q on SEC EDGAR · CIK 885590 · Pharmaceutical Preparations
13F: who owns BHC and who is buying
More on BHC
- How Bausch Health Companies makes money: revenue by segment
- Bausch Health Companies next earnings date and what analysts expect
- Bausch Health Companies stock forecast, price target and fair value
- Who owns Bausch Health Companies stock: holders, funds and Congress trades
- Bausch Health Companies guidance and outlook
- Is Bausch Health Companies a takeover target? LBO and rumors
- Bausch Health Companies recalls, complaints and regulation
History
Every quarter: Q3 2026 results · Q2 2026 results · Q1 2026 results · Q4 2025 results · Q3 2025 results · Q2 2025 results · Q1 2025 results
- Bausch Health Companies operating margin by quarter
- Bausch Health Companies net income by quarter
- Bausch Health Companies free cash flow by quarter
- Bausch Health Companies R&D spending by quarter
- Bausch Health Companies capital expenditures by quarter
- Bausch Health Companies Product sales revenue by quarter