Filing Flows › Health Care › Cencora (COR)
Cencora (COR) earnings and revenue breakdown
Latest: Q3 FY26 · 10-Q filed Aug 5, 2026 · Cencora (COR) Q3 FY26 earnings results →
Q3 FY26 Revenue up 5% year over year to $84.8B · 1¢ of every $1 of revenue kept as net profit · operating margin 1.3%
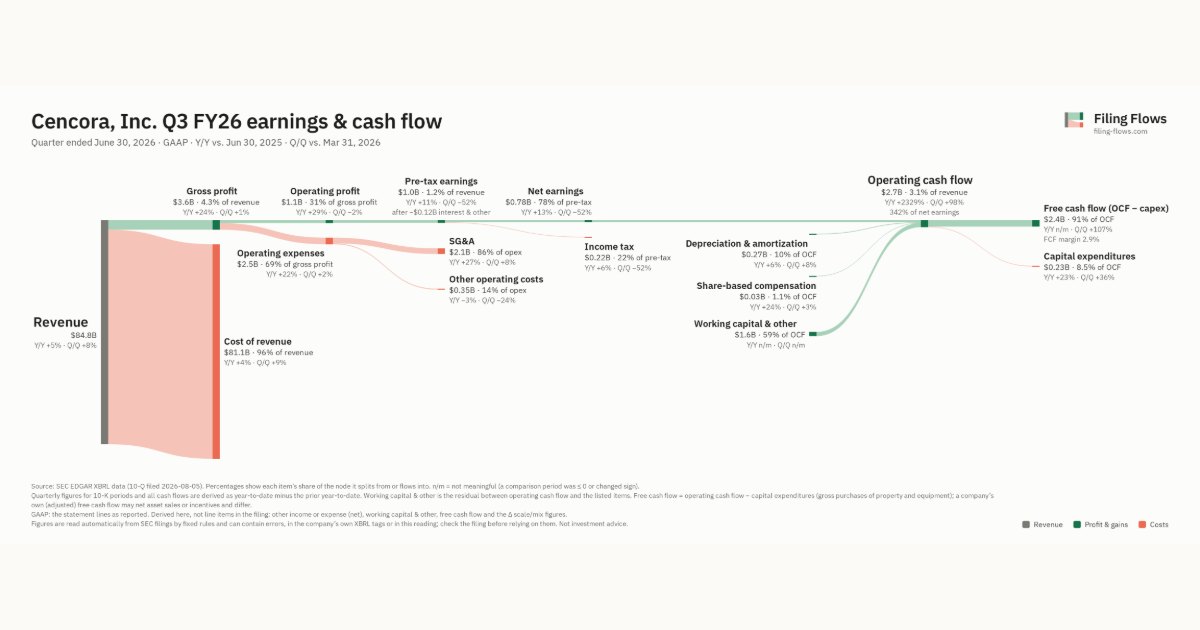
Cencora made $84.8B in Q3 FY26 (+5% Y/Y). Operating margin 1.3%, net earnings $777M. See where every dollar goes — costs, profit and cash — as a Sankey from the 10-Q filed Aug 5, 2026.
Drawing the Sankey…
Open the interactive Sankey → click any line for what the company wrote about it, compare Y/Y and Q/Q, export as PNG or PDF
What changed this quarter
Revenue was $84.8B in Q3 FY26, up 5% year over year and up 8% from the previous quarter.
Gross margin was 4.3%, up 0.7 points from Q3 FY25. Operating profit was $1.1B, a 1.3% margin (up 0.2 points year over year). Of the extra revenue versus Q3 FY25, 6% reached operating profit, above the 1% margin then. Operating expenses grew 22% against revenue growth of 5%. The fastest-growing cost line was SG&A (+27%). Net earnings were $0.76B, up 11% year over year. The effective tax rate was 22.1%.
Operating cash flow was $2.7B (up 2329% year over year), 342% of net earnings. Non-cash charges added back $0.27B of depreciation and amortization and $0.03B of share-based compensation. Working capital and other items added $1.6B. Capital expenditures of $0.23B left free cash flow of $2.4B.
Quarterly history
| Quarter | Form | Filed | Revenue | Y/Y | Op. margin | Net earnings | Op. cash flow |
|---|---|---|---|---|---|---|---|
| Q3 FY26 | 10-Q | Aug 5, 2026 | $84.8B | +5% | 1.3% | $777M | $2.7B |
| Q2 FY26 | 10-Q | May 6, 2026 | $78.4B | +4% | 1.5% | $1.6B | $1.3B |
| Q1 FY26 | 10-Q | Feb 4, 2026 | $85.9B | +6% | 0.9% | $566M | −$2.3B |
| Q4 FY25 | 10-K | Nov 25, 2025 | $83.7B | +6% | 0.0% | −$333M | $3.1B |
| Q3 FY25 | 10-Q | Aug 6, 2025 | $80.7B | +9% | 1.1% | $690M | $109M |
| Q2 FY25 | 10-Q | May 7, 2025 | $75.5B | +10% | 1.4% | $717M | $3.4B |
| Q4 FY24 | 10-K | Nov 26, 2024 | $79.1B | +15% | 0.2% | $7.5M | $1.0B |
Charts
Interactive views
The same charts as the app — open one to draw it.
💵Where each $1 goesinteractive
Loading the interactive chart…
🌏Named in Asian annual reportsinteractive
Loading the interactive chart…
🔄Rotation against the market and its industry (RRG)interactive
Loading the interactive chart…
🔍Earnings qualityinteractive
Loading the interactive chart…
⚖️Fair value by methodinteractive
Loading the interactive chart…
🔭Outlook & guidanceinteractive
Loading the interactive chart…
📈Investments: gains and what it boughtinteractive
Loading the interactive chart…
🏭Its industry’s money flow (input-output)interactive
Loading the interactive chart…
Customers and suppliers named in filings
Sells to
- Walgreens and Boots UK Ltd — 25% of its revenue · Stated in 10-K (XBRL) · source
- CI — 13% of its revenue · Stated in 10-K (sentence) · source
Buys from
- Keenova Therapeutics plc — 48% of the supplier’s revenue · Stated in 10-K (customer table) · source
- ADCT — 39% of the supplier’s revenue · Stated in 10-K (XBRL) · source
- CHRS — 36% of the supplier’s revenue · Stated in 10-K (XBRL) · source
- BMY — 29% of the supplier’s revenue · Stated in 10-K (XBRL) · source
- AMGN — 27% of the supplier’s revenue · Stated in 10-K (XBRL) · source
- PCRX — 22% of the supplier’s revenue · Stated in 10-K (sentence) · source
- AMPH — 22% of the supplier’s revenue · Stated in 10-K (XBRL) · source
- AKBA — 19% of the supplier’s revenue · Stated in 10-K (customer table) · source
- RIGL — 19% of the supplier’s revenue · Stated in 10-K (customer table) · source
- BHC — 18% of the supplier’s revenue · Stated in 10-K (customer table) · source
- ALKS — 18% of the supplier’s revenue · Stated in 10-K (sentence) · source
- PFE — 16% of the supplier’s revenue · Stated in 10-K (XBRL) · source
About Cencora
Cencora is one of the largest global pharmaceutical sourcing and distribution services companies, helping both healthcare providers and pharmaceutical and biotech manufacturers improve patient access to products and enhance patient care. We deliver innovative programs and services designed to increase the effectiveness and efficiency of the pharmaceutical supply chain in both human and animal health. More specifically, we distribute a comprehensive offering of brand-name, specialty brand-name, and generic pharmaceuticals, over-the-counter healthcare products, home healthcare supplies and equipment, and related services to a wide variety of healthcare providers located in the United States and select global markets, including acute care hospitals and health systems, independent and chain retail pharmacies, mail order pharmacies, medical clinics, long-term care and alternate site…
In its own words, from its 10-K, filed Nov 25, 2025.
Cencora against its Wholesale-Drugs, Proprietaries & Druggists' Sundries peers
The largest companies of the same SEC industry, each at its latest quarter. Revenue growth: +5% against the peers' median +5%. Operating margin: 1.3% against the peers' median 1.3%.
| Company | Quarter | Revenue | Y/Y | Op. margin |
|---|---|---|---|---|
| COR Cencora | Q3 FY26 | $84.8B | +5% | 1.3% |
| MCK McKesson | Q2 FY27 | $111.0B | +8% | 1.4% |
| CAH Cardinal Health | Q1 FY27 | $67.5B | +6% | 1.1% |
| HLF Herbalife | Q3 2026 | $1.4B | +6% | 10.3% |
| NUS Nu Skin Enterprises | Q3 2026 | $311M | -15% | 1.6% |
| COSM Cosmos Health | Q2 2026 | $19.0M | +29% | -15.4% |
| MEDS DataMeds AI | Q2 2026 | $1.8M | -77% | -412.7% |
| STEK Stemtech | Q2 2026 | $629K | -10% | -20.0% |
| ESYN HWH International | Q2 2026 | $64K | -79% | 328.1% |
Source: Cencora 10-Q on SEC EDGAR · CIK 1140859 · Wholesale-Drugs, Proprietaries & Druggists' Sundries
Guidance and outlook
13F: who owns COR and who is buying
More on COR
History
Every quarter: Q3 FY26 results · Q2 FY26 results · Q1 FY26 results · Q4 FY25 results · Q3 FY25 results · Q2 FY25 results · Q4 FY24 results