Filing Flows › Health Care › Amgen (AMGN)
Amgen (AMGN) earnings and revenue breakdown
Latest: Q3 2026 · 10-Q filed Nov 4, 2026 · Amgen (AMGN) Q3 2026 earnings results →
Q3 2026 Revenue up 8% year over year to $10.4B · 37¢ of every $1 of revenue kept as net profit · operating margin 35.8%
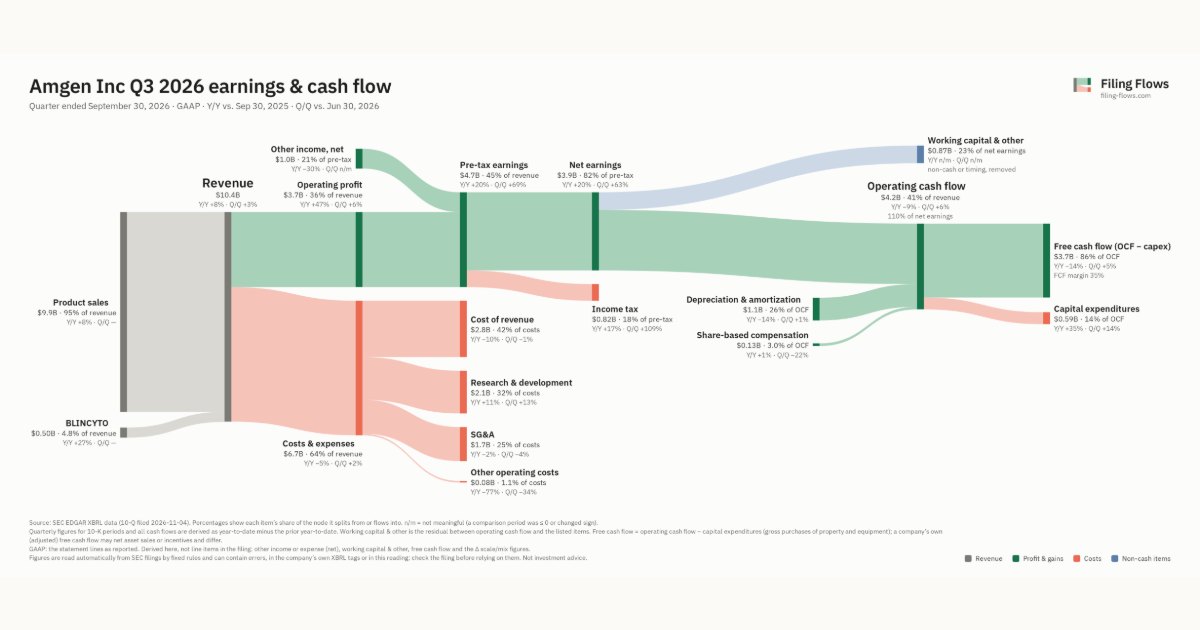
Amgen made $10.4B in Q3 2026 (+8% Y/Y): Product sales $9.9B, BLINCYTO $496M. Operating margin 35.8%, net earnings $3.9B. See where every dollar goes — costs, profit and cash — as a Sankey from the 10-Q filed Nov 4, 2026.
Drawing the Sankey…
Open the interactive Sankey → click any line for what the company wrote about it, compare Y/Y and Q/Q, export as PNG or PDF
What changed this quarter
Revenue was $10.4B in Q3 2026, up 8% year over year and up 3% from the previous quarter. Product sales was the largest line at 95% of revenue. Product sales added $0.75B year over year (up 8%), 92% of the total change.
Operating profit was $3.7B, a 35.8% margin (up 9.4 points year over year). Of the extra revenue versus Q3 2025, 147% reached operating profit, above the 26% margin then. Total costs fell 5% while revenue rose 8%. The fastest-growing cost line was Research & development (+11%). Net earnings were $3.9B, up 20% year over year. The effective tax rate was 17.5%. Non-operating items added $1.0B, 21% of pre-tax earnings, so the bottom line overstates operating performance.
Operating cash flow was $4.2B (down 9% year over year), 110% of net earnings. Non-cash charges added back $1.1B of depreciation and amortization and $0.13B of share-based compensation. Working capital and other items used $0.87B. Capital expenditures of $0.59B left free cash flow of $3.7B.
Quarterly history
| Quarter | Form | Filed | Revenue | Y/Y | Op. margin | Net earnings | Op. cash flow |
|---|---|---|---|---|---|---|---|
| Q3 2026 | 10-Q | Nov 4, 2026 | $10.4B | +8% | 35.8% | $3.9B | $4.2B |
| Q2 2026 | 10-Q | Aug 5, 2026 | $10.1B | +10% | 35.0% | $2.4B | $4.0B |
| Q1 2026 | 10-Q | May 1, 2026 | $8.6B | +6% | 30.9% | $1.8B | $2.2B |
| Q4 2025 | 10-K | Feb 13, 2026 | $9.9B | +9% | 27.6% | $1.3B | $1.6B |
| Q3 2025 | 10-Q | Nov 5, 2025 | $9.6B | +12% | 26.4% | $3.2B | $4.7B |
| Q2 2025 | 10-Q | Aug 6, 2025 | $9.2B | +9% | 28.9% | $1.4B | $2.3B |
| Q1 2025 | 10-Q | May 2, 2025 | $8.1B | +9% | 14.5% | $1.7B | $1.4B |
Charts
Interactive views
The same charts as the app — open one to draw it.
💵Where each $1 goesinteractive
Loading the interactive chart…
🌏Named in Asian annual reportsinteractive
Loading the interactive chart…
🔄Rotation against the market and its industry (RRG)interactive
Loading the interactive chart…
🔍Earnings qualityinteractive
Loading the interactive chart…
⚖️Fair value by methodinteractive
Loading the interactive chart…
🔭Outlook & guidanceinteractive
Loading the interactive chart…
📈Investments: gains and what it boughtinteractive
Loading the interactive chart…
🏭Its industry’s money flow (input-output)interactive
Loading the interactive chart…
Customers and suppliers named in filings
Sells to
- MCK — 34% of its revenue · Stated in 10-K (XBRL) · source
- COR — 27% of its revenue · Stated in 10-K (XBRL) · source
- CAH — 16% of its revenue · Stated in 10-K (XBRL) · source
About Amgen
Amgen discovers, develops, manufactures and delivers innovative medicines to fight some of the world’s toughest diseases. Harnessing the best of biology and technology, Amgen reaches millions of patients with its medicines. More than 45 years ago, Amgen helped establish the biotechnology industry at its U.S. headquarters in Thousand Oaks, California, and it remains at the cutting edge of innovation, using technology and human genetic data to push beyond what is known today. Amgen is advancing a broad and deep pipeline and portfolio of medicines to treat cancer, heart disease, inflammatory conditions, rare diseases and obesity and obesity-related conditions.
In its own words, from its 8-K, filed Aug 4, 2026.
Amgen against its Biological Products, (No Diagnostic Substances) peers
The largest companies of the same SEC industry, each at its latest quarter. Revenue growth: +8% against the peers' median +11%. Operating margin: 35.8% against the peers' median 35.8%.
| Company | Quarter | Revenue | Y/Y | Op. margin |
|---|---|---|---|---|
| AMGN Amgen | Q3 2026 | $10.4B | +8% | 35.8% |
| GILD Gilead Sciences | Q3 2026 | $8.3B | +7% | 41.7% |
| BIIB Biogen | Q3 2026 | $2.8B | +11% | -0.3% |
| MRNA Moderna | Q3 2026 | $1.3B | +29% | 9.9% |
| NBIX Neurocrine Biosciences | Q3 2026 | $1.1B | +41% | 29.5% |
| EXEL Exelixis | Q3 2026 | $659M | +10% | 40.8% |
| HALO Halozyme Therapeutics | Q3 2026 | $493M | +39% | 59.8% |
| MGTX MeiraGTx Holdings | Q2 2026 | $321M | 87× | 76.0% |
| TECH Bio-Techne | Q1 FY27 | $300M | +5% | 12.2% |
Source: Amgen 10-Q on SEC EDGAR · CIK 318154 · Biological Products, (No Diagnostic Substances)
Guidance and outlook
13F: who owns AMGN and who is buying
More on AMGN
- How Amgen makes money: revenue by segment
- Amgen next earnings date and what analysts expect
- Amgen stock forecast, price target and fair value
- Who owns Amgen stock: holders, funds and Congress trades
- Amgen guidance and outlook
- Is Amgen a takeover target? LBO and rumors
- Amgen recalls, complaints and regulation
History
Every quarter: Q3 2026 results · Q2 2026 results · Q1 2026 results · Q4 2025 results · Q3 2025 results · Q2 2025 results · Q1 2025 results