Filing Flows › Health Care › Biogen (BIIB)
Biogen (BIIB) earnings and revenue breakdown
Latest: Q3 2026 · 10-Q filed Oct 28, 2026 · Biogen (BIIB) Q3 2026 earnings results →
Q3 2026 Revenue up 11% year over year to $2.8B · 1¢ of every $1 of revenue lost · operating margin -0.3%
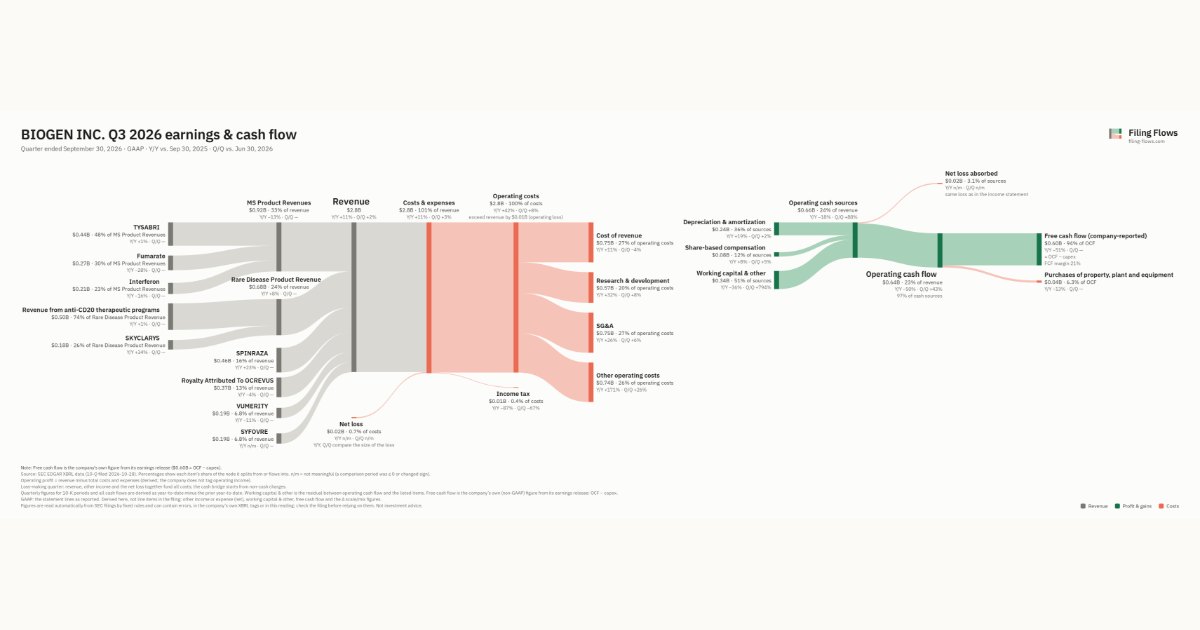
Biogen made $2.8B in Q3 2026 (+11% Y/Y): MS Product Revenues $919M, Rare Disease Product Revenue $676M, SPINRAZA $461M. Operating margin -0.3%, net loss $20.6M. See where every dollar goes — costs, profit and cash — as a Sankey from the 10-Q filed Oct 28, 2026.
Drawing the Sankey…
Open the interactive Sankey → click any line for what the company wrote about it, compare Y/Y and Q/Q, export as PNG or PDF
What changed this quarter
Revenue was $2.8B in Q3 2026, up 11% year over year and up 2% from the previous quarter. Revenue from anti-CD20 therapeutic programs was the largest line at 18% of revenue. SPINRAZA added $0.09B year over year (up 23%), 32% of the total change. Fumarate declined 28%.
Operating costs exceeded revenue by $0.01B, an operating margin of -0.3%. Total costs grew 42% against revenue growth of 11%. The fastest-growing cost line was Other operating costs (+171%). The quarter ended with a net loss of $0.02B, after a profit of $0.10B the previous quarter.
Operating cash flow was $0.64B (down 50% year over year). Non-cash charges added back $0.24B of depreciation and amortization and $0.08B of share-based compensation. Working capital and other items added $0.34B. After purchases of property, plant and equipment ($0.04B), free cash flow as the company reports it was $0.60B.
Quarterly history
| Quarter | Form | Filed | Revenue | Y/Y | Op. margin | Net earnings | Op. cash flow |
|---|---|---|---|---|---|---|---|
| Q3 2026 | 10-Q | Oct 28, 2026 | $2.8B | +11% | -0.3% | −$20.6M | $641M |
| Q2 2026 | 10-Q | Jul 29, 2026 | $2.7B | +3% | 4.8% | $97.5M | $449M |
| Q1 2026 | 10-Q | Apr 29, 2026 | $2.5B | +2% | 15.2% | $320M | $646M |
| Q4 2025 | 10-K | Feb 6, 2026 | $2.3B | -7% | -2.5% | −$48.9M | $512M |
| Q3 2025 | 10-Q | Oct 30, 2025 | $2.5B | +3% | 22.0% | $466M | $1.3B |
| Q2 2025 | 10-Q | Jul 31, 2025 | $2.6B | +7% | 28.1% | $635M | $161M |
| Q1 2025 | 10-Q | May 1, 2025 | $2.4B | +6% | 12.8% | $240M | $259M |
Charts
Interactive views
The same charts as the app — open one to draw it.
💵Where each $1 goesinteractive
Loading the interactive chart…
🌏Named in Asian annual reportsinteractive
Loading the interactive chart…
🔄Rotation against the market and its industry (RRG)interactive
Loading the interactive chart…
🔍Earnings qualityinteractive
Loading the interactive chart…
⚖️Fair value by methodinteractive
Loading the interactive chart…
🔭Outlook & guidanceinteractive
Loading the interactive chart…
📈Investments: gains and what it boughtinteractive
Loading the interactive chart…
🏭Its industry’s money flow (input-output)interactive
Loading the interactive chart…
About Biogen
Biogen is a global biopharmaceutical company focused on discovering, developing and delivering innovative therapies for people living with serious and complex diseases. We have a broad portfolio of medicines to treat MS, have introduced the first approved treatment for SMA, co-developed treatments to address a defining pathology of Alzheimer’s disease and launched the first approved treatment to target a genetic cause of ALS. We market the first and only drug approved in the U.S., the E.U. and certain international markets for the treatment of FA in adults and adolescents aged 16 years and older. We are focused on advancing our pipeline in neurology, specialized immunology and rare diseases. We support our drug discovery and development efforts through internal research and development programs, external collaborations and acquisitions.
In its own words, from its 10-K, filed Feb 6, 2026.
Biogen against its Biological Products, (No Diagnostic Substances) peers
The largest companies of the same SEC industry, each at its latest quarter. Revenue growth: +11% against the peers' median +11%. Operating margin: -0.3% against the peers' median 35.8%.
| Company | Quarter | Revenue | Y/Y | Op. margin |
|---|---|---|---|---|
| BIIB Biogen | Q3 2026 | $2.8B | +11% | -0.3% |
| AMGN Amgen | Q3 2026 | $10.4B | +8% | 35.8% |
| GILD Gilead Sciences | Q3 2026 | $8.3B | +7% | 41.7% |
| MRNA Moderna | Q3 2026 | $1.3B | +29% | 9.9% |
| NBIX Neurocrine Biosciences | Q3 2026 | $1.1B | +41% | 29.5% |
| EXEL Exelixis | Q3 2026 | $659M | +10% | 40.8% |
| HALO Halozyme Therapeutics | Q3 2026 | $493M | +39% | 59.8% |
| MGTX MeiraGTx Holdings | Q2 2026 | $321M | 87× | 76.0% |
| TECH Bio-Techne | Q1 FY27 | $300M | +5% | 12.2% |
Source: Biogen 10-Q on SEC EDGAR · CIK 875045 · Biological Products, (No Diagnostic Substances)
Guidance and outlook
13F: who owns BIIB and who is buying
More on BIIB
History
Every quarter: Q3 2026 results · Q2 2026 results · Q1 2026 results · Q4 2025 results · Q3 2025 results · Q2 2025 results · Q1 2025 results