Filing Flows › Technology › ChargePoint Holdings (CHPT)
ChargePoint Holdings (CHPT) earnings and revenue breakdown
Latest: Q2 FY27 · 10-Q filed Sep 4, 2026 · ChargePoint Holdings (CHPT) Q2 FY27 earnings results →
Q2 FY27 Revenue up 18% year over year to $116M · 31¢ of every $1 of revenue lost · operating margin -29.3%
ChargePoint Holdings made $116M in Q2 FY27 (+18% Y/Y): Networked Charging Systems $62.9M, Subscriptions $43.7M, Other $9.5M. Operating margin -29.3%, net loss $35.6M. See where every dollar goes — costs, profit and cash — as a Sankey from the 10-Q filed Sep 4, 2026.
Drawing the Sankey…
Open the interactive Sankey → click any line for what the company wrote about it, compare Y/Y and Q/Q, export as PNG or PDF
What changed this quarter
Revenue was $116.1M in Q2 FY27, up 18% year over year and up 14% from the previous quarter. Networked Charging Systems was the largest line at 54% of revenue. Networked Charging Systems added $12.5M year over year (up 25%), 71% of the total change.
Gross margin was 36.4%, up 5.3 points from Q2 FY26. Operating costs exceeded revenue by $34.1M, an operating margin of -29.3%. Operating expenses fell 15% while revenue rose 18%. The quarter ended with a net loss of $35.6M, narrower than the previous quarter's $43.2M loss.
Operating cash flow was −$4.2M. Non-cash charges added back $6.1M of depreciation and amortization and $11.0M of share-based compensation. Working capital and other items added $14.3M. Capital expenditures of $1.0M exceeded it, leaving free cash flow of −$5.2M.
Quarterly history
| Quarter | Form | Filed | Revenue | Y/Y | Op. margin | Net earnings | Op. cash flow |
|---|---|---|---|---|---|---|---|
| Q2 FY27 | 10-Q | Sep 4, 2026 | $116M | +18% | -29.3% | −$35.6M | −$4.2M |
| Q1 FY27 | 10-Q | Jun 8, 2026 | $102M | +4% | -46.3% | −$43.2M | −$36.6M |
| Q4 FY26 | 10-K | Apr 2, 2026 | $109M | +7% | -48.5% | −$44.4M | −$1.2M |
| Q3 FY26 | 10-Q | Dec 5, 2025 | $106M | +6% | -42.0% | −$52.5M | −$22.5M |
| Q2 FY26 | 10-Q | Sep 8, 2025 | $98.6M | -9% | -59.8% | −$66.2M | −$6.2M |
| Q1 FY26 | 10-Q | Jun 6, 2025 | $97.6M | -9% | -55.1% | −$57.1M | −$33.0M |
| Q4 FY25 | 10-K | Mar 28, 2025 | $102M | -12% | -53.9% | −$58.8M | −$2.7M |
Charts
In supply chains and themes
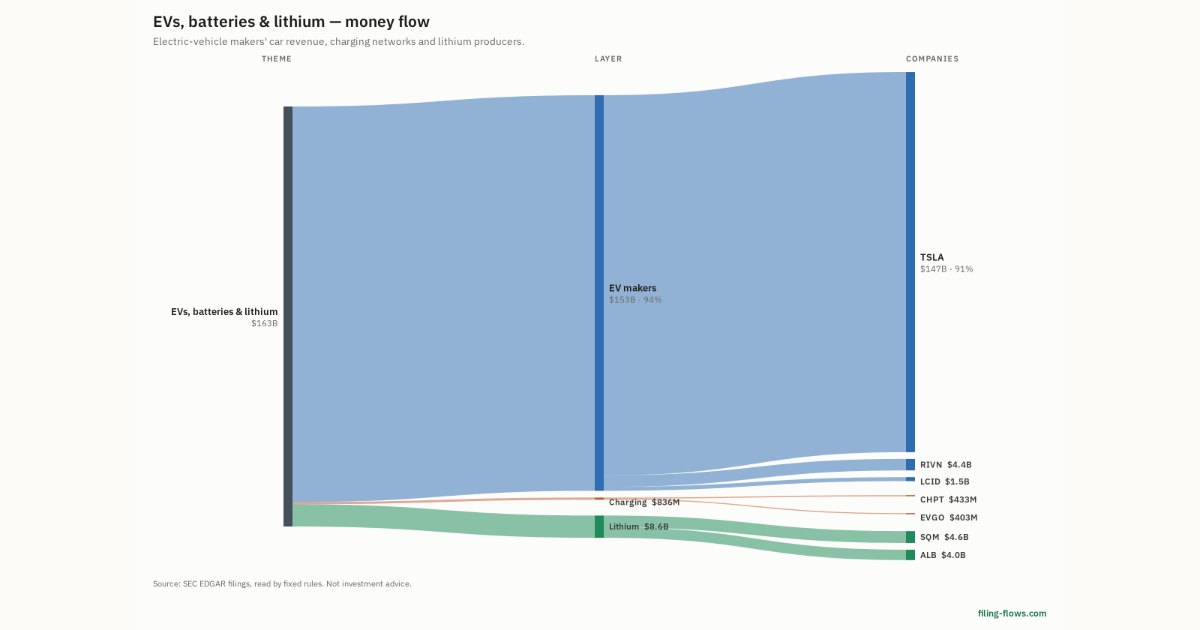
Interactive views
The same charts as the app — open one to draw it.
💵Where each $1 goesinteractive
Loading the interactive chart…
🌏Named in Asian annual reportsinteractive
Loading the interactive chart…
🔄Rotation against the market and its industry (RRG)interactive
Loading the interactive chart…
🔍Earnings qualityinteractive
Loading the interactive chart…
⚖️Fair value by methodinteractive
Loading the interactive chart…
🔭Outlook & guidanceinteractive
Loading the interactive chart…
📈Investments: gains and what it boughtinteractive
Loading the interactive chart…
🏭Its industry’s money flow (input-output)interactive
Loading the interactive chart…
About ChargePoint Holdings
ChargePoint Holdings, Inc. (“ChargePoint” or the “Company”) is a leading provider of electric vehicle (“EV”) charging technology solutions to customers that want to offer EV charging, driving the transition to electric mobility across North America and Europe. ChargePoint’s vision is to create a seamless, ubiquitous, and accessible EV charging experience for all. Our mission is to simplify the transition to electric vehicles for everyone, from individual drivers to businesses and organizations of all sizes. By meeting the needs of a rapidly evolving EV market, ChargePoint enables its customers to reduce emissions, supports renewable energy integration, and promotes sustainable transportation. ChargePoint powers over 385,000 “active” charging ports, which ChargePoint defines as ports that are running on ChargePoint software, serving more than 1,480,000 active EV drivers quarterly.
In its own words, from its 10-K, filed Apr 2, 2026.
ChargePoint Holdings against its Miscellaneous Electrical Machinery, Equipment & Supplies peers
The largest companies of the same SEC industry, each at its latest quarter. Revenue growth: +18% against the peers' median +8%. Operating margin: -29.3% against the peers' median 2.1%.
| Company | Quarter | Revenue | Y/Y | Op. margin |
|---|---|---|---|---|
| CHPT ChargePoint Holdings | Q2 FY27 | $116M | +18% | -29.3% |
| ENS EnerSys | Q1 FY27 | $936M | +5% | 16.2% |
| ATKR Atkore | Q3 FY26 | $795M | +8% | 8.1% |
| SPB Spectrum Brands Holdings | Q3 FY26 | $753M | +8% | 2.1% |
| ENR Energizer Holdings | Q3 FY26 | $734M | +1% | 6.8% |
| FLNC Fluence Energy | Q3 FY26 | $650M | +8% | -6.7% |
| NOVT Novanta | Q2 2026 | $266M | +10% | 6.8% |
| MVST Microvast Holdings | Q2 2026 | $87.3M | -4% | -2.0% |
| EOSE Eos Energy Enterprises | Q3 2026 | $82.7M | +171% | -95.9% |
Source: ChargePoint Holdings 10-Q on SEC EDGAR · CIK 1777393 · Miscellaneous Electrical Machinery, Equipment & Supplies
13F: who owns CHPT and who is buying
More on CHPT
History
Every quarter: Q2 FY27 results · Q1 FY27 results · Q4 FY26 results · Q3 FY26 results · Q2 FY26 results · Q1 FY26 results · Q4 FY25 results