Filing Flows › Real Estate › Prologis, L.P.
Prologis, L.P. earnings and revenue breakdown
Latest: Q3 2026 · 10-Q filed Oct 28, 2026
Q3 2026 Revenue up 8% year over year to $2.4B · 34¢ of every $1 of revenue kept as net profit · operating margin 43.8%
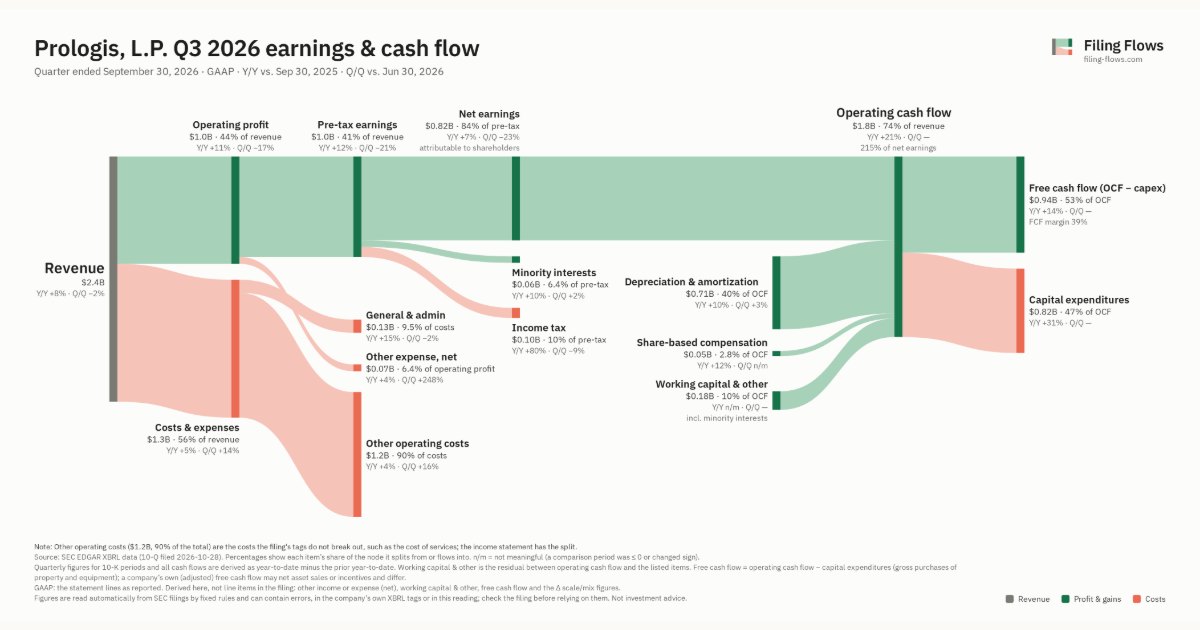
Prologis, L.P. made $2.4B in Q3 2026 (+8% Y/Y). Operating margin 43.8%, net earnings $817M. See where every dollar goes — costs, profit and cash — as a Sankey from the 10-Q filed Oct 28, 2026.
Drawing the Sankey…
Open the interactive Sankey → click any line for what the company wrote about it, compare Y/Y and Q/Q, export as PNG or PDF
What changed this quarter
Revenue was $2.4B in Q3 2026, up 8% year over year and down 2% from the previous quarter.
Operating profit was $1.0B, a 43.8% margin (up 1.3 points year over year). Of the extra revenue versus Q3 2025, 60% reached operating profit, above the 42% margin then. Total costs grew 5% against revenue growth of 8%. The fastest-growing cost line was General & admin (+15%). Net earnings were $0.82B, up 7% year over year. The effective tax rate was 10.0%.
Operating cash flow was $1.8B (up 21% year over year), 200% of net income including minority interests. Non-cash charges added back $0.71B of depreciation and amortization and $0.05B of share-based compensation. Working capital and other items added $0.12B. Capital expenditures of $0.82B left free cash flow of $0.94B.
Quarterly history
| Quarter | Form | Filed | Revenue | Y/Y | Op. margin | Net earnings | Op. cash flow |
|---|---|---|---|---|---|---|---|
| Q3 2026 | 10-Q | Oct 28, 2026 | $2.4B | +8% | 43.8% | $817M | $1.8B |
| Q2 2026 | 10-Q | Jul 29, 2026 | $2.4B | +11% | 51.6% | $1.1B | $1.3B |
| Q1 2026 | 10-Q | Apr 30, 2026 | $2.3B | +7% | 52.7% | $982M | $1.3B |
| Q4 2025 | 10-K | Feb 13, 2026 | $2.3B | +2% | 72.2% | $1.4B | $1.2B |
| Q3 2025 | 10-Q | Oct 28, 2025 | $2.2B | +9% | 42.5% | $764M | $1.4B |
| Q2 2025 | 10-Q | Jul 30, 2025 | $2.2B | — | 41.8% | $571M | $1.2B |
| Q1 2025 | 10-Q | Apr 29, 2025 | $2.1B | +9% | 41.1% | $593M | $1.2B |
Charts
Interactive views
The same charts as the app — open one to draw it.
💵Where each $1 goesinteractive
Loading the interactive chart…
🌏Named in Asian annual reportsinteractive
Loading the interactive chart…
🏭Its industry’s money flow (input-output)interactive
Loading the interactive chart…
About Prologis, L.P.
Prologis, Inc. is a self-administered and self-managed REIT and is the sole general partner of Prologis, L.P. through which it holds substantially all of its assets. We operate Prologis, Inc. and Prologis, L.P. as one enterprise and, therefore, our discussion and analysis refers to Prologis, Inc. and its consolidated subsidiaries, including Prologis, L.P. We invest in real estate through wholly owned subsidiaries and other entities through which we co-invest with partners and investors ("co-investment ventures"). We have a significant ownership interest in the co-investment ventures, which are either consolidated or unconsolidated based on our level of control of the entity.
In its own words, from its 10-K, filed Feb 13, 2026.
Prologis, L.P. against its Real Estate peers
The largest companies of the same SEC industry, each at its latest quarter. Revenue growth: +8% against the peers' median +8%. Operating margin: 43.8% against the peers' median 15.9%.
| Company | Quarter | Revenue | Y/Y | Op. margin |
|---|---|---|---|---|
| Prologis, L.P. | Q3 2026 | $2.4B | +8% | 43.8% |
| CBRE CBRE Group | Q3 2026 | $11.5B | +13% | 4.9% |
| CWK Cushman & Wakefield | Q3 2026 | $2.8B | +8% | 4.6% |
| Digital Realty Trust, L.P. | Q3 2026 | $1.9B | +21% | 15.9% |
| FOR Forestar Group | Q4 FY26 | $581M | -13% | 13.5% |
| Regency Centers LP | Q3 2026 | $419M | +8% | 72.3% |
| Tiaa Real Estate Account | Q3 2026 | $303M | -0.8% | 298.8% |
| MRP Millrose Properties | Q3 2026 | $211M | +18% | 85.5% |
| HPP Hudson Pacific Properties | Q2 2026 | $188M | -0.9% | -55.4% |
Source: Prologis, L.P. 10-Q on SEC EDGAR · CIK 1045610 · Real Estate