Filing Flows › Real Estate › CBRE Group (CBRE)
CBRE Group (CBRE) earnings and revenue breakdown
Latest: Q3 2026 · 10-Q filed Oct 22, 2026 · CBRE Group (CBRE) Q3 2026 earnings results →
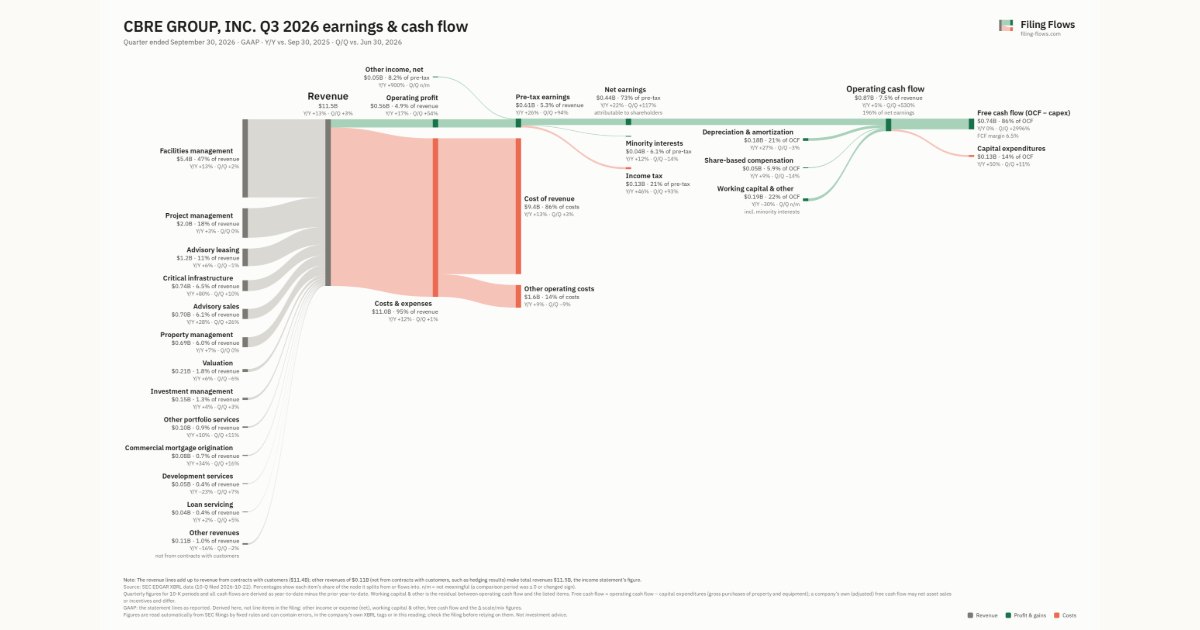
Q3 2026 Revenue up 13% year over year to $11.5B · 4¢ of every $1 of revenue kept as net profit · operating margin 4.9%
CBRE Group made $11.5B in Q3 2026 (+13% Y/Y): Facilities management $5.4B, Project management $2.0B, Advisory leasing $1.2B. Operating margin 4.9%, net earnings $443M. See where every dollar goes — costs, profit and cash — as a Sankey from the 10-Q filed Oct 22, 2026.
Drawing the Sankey…
Open the interactive Sankey → click any line for what the company wrote about it, compare Y/Y and Q/Q, export as PNG or PDF
What changed this quarter
Revenue was $11.5B in Q3 2026, up 13% year over year and up 3% from the previous quarter. Facilities management was the largest line at 47% of revenue. Facilities management added $0.63B year over year (up 13%), 49% of the total change. Development services declined 23%.
Operating profit was $0.56B, a 4.9% margin (up 0.2 points year over year). Of the extra revenue versus Q3 2025, 6% reached operating profit, above the 5% margin then. Total costs grew 12% against revenue growth of 13%. The fastest-growing cost line was Cost of revenue (+13%). Net earnings were $0.44B, up 22% year over year. The effective tax rate was 21.4%.
Operating cash flow was $0.87B (up 5% year over year), 181% of net income including minority interests. Non-cash charges added back $0.18B of depreciation and amortization and $0.05B of share-based compensation. Working capital and other items added $0.15B. Capital expenditures of $0.13B left free cash flow of $0.74B.
Quarterly history
| Quarter | Form | Filed | Revenue | Y/Y | Op. margin | Net earnings | Op. cash flow |
|---|---|---|---|---|---|---|---|
| Q3 2026 | 10-Q | Oct 22, 2026 | $11.5B | +13% | 4.9% | $443M | $869M |
| Q2 2026 | 10-Q | Jul 29, 2026 | $11.2B | +16% | 3.3% | $204M | $138M |
| Q1 2026 | 10-Q | Apr 23, 2026 | $10.5B | +19% | 4.9% | $318M | −$825M |
| Q4 2025 | 10-K | Feb 12, 2026 | $11.7B | +13% | 5.3% | $416M | $1.2B |
| Q3 2025 | 10-Q | Oct 23, 2025 | $10.2B | +13% | 4.7% | $363M | $827M |
| Q2 2025 | 10-Q | Jul 29, 2025 | $9.7B | +16% | 3.8% | $215M | $57.0M |
| Q1 2025 | 10-Q | Apr 24, 2025 | $8.9B | +12% | 3.1% | $163M | −$546M |
Charts
Interactive views
The same charts as the app — open one to draw it.
💵Where each $1 goesinteractive
Loading the interactive chart…
🌏Named in Asian annual reportsinteractive
Loading the interactive chart…
🔄Rotation against the market and its industry (RRG)interactive
Loading the interactive chart…
🔍Earnings qualityinteractive
Loading the interactive chart…
⚖️Fair value by methodinteractive
Loading the interactive chart…
🔭Outlook & guidanceinteractive
Loading the interactive chart…
📈Investments: gains and what it boughtinteractive
Loading the interactive chart…
🏭Its industry’s money flow (input-output)interactive
Loading the interactive chart…
Customers and suppliers named in filings
Buys from
- FNMA · Stated in 10-K (named, share not stated) · source
- FMCC · Stated in 10-K (named, share not stated) · source
About CBRE Group
CBRE is the world’s largest commercial real estate services and investments firm (based on 2025 revenue). We derive competitive advantage from our considerable scale and ability to offer integrated solutions for real estate investors and occupiers in more than 100 countries. We are global market leaders in most of our business lines and drive significant growth by helping clients optimize real estate costs, value, investment returns and workplace experiences. These capabilities, combined with our extensive knowledge platform (research, data, strategy, etc.), allow us to generate superior outcomes for our clients, which included nearly 90% of Fortune 100 companies and many of the world’s largest institutional real estate investors in 2025.
In its own words, from its 10-K, filed Feb 12, 2026.
CBRE Group against its Real Estate peers
The largest companies of the same SEC industry, each at its latest quarter. Revenue growth: +13% against the peers' median +8%. Operating margin: 4.9% against the peers' median 15.9%.
| Company | Quarter | Revenue | Y/Y | Op. margin |
|---|---|---|---|---|
| CBRE CBRE Group | Q3 2026 | $11.5B | +13% | 4.9% |
| CWK Cushman & Wakefield | Q3 2026 | $2.8B | +8% | 4.6% |
| Prologis, L.P. | Q3 2026 | $2.4B | +8% | 43.8% |
| Digital Realty Trust, L.P. | Q3 2026 | $1.9B | +21% | 15.9% |
| FOR Forestar Group | Q4 FY26 | $581M | -13% | 13.5% |
| Regency Centers LP | Q3 2026 | $419M | +8% | 72.3% |
| Tiaa Real Estate Account | Q3 2026 | $303M | -0.8% | 298.8% |
| MRP Millrose Properties | Q3 2026 | $211M | +18% | 85.5% |
| HPP Hudson Pacific Properties | Q2 2026 | $188M | -0.9% | -55.4% |
Source: CBRE Group 10-Q on SEC EDGAR · CIK 1138118 · Real Estate
Guidance and outlook
13F: who owns CBRE and who is buying
More on CBRE
History
Every quarter: Q3 2026 results · Q2 2026 results · Q1 2026 results · Q4 2025 results · Q3 2025 results · Q2 2025 results · Q1 2025 results
- CBRE Group guidance history: guided vs reported
- CBRE Group operating margin by quarter
- CBRE Group net income by quarter
- CBRE Group free cash flow by quarter
- CBRE Group capital expenditures by quarter
- CBRE Group Facilities management revenue by quarter
- CBRE Group Project management revenue by quarter
- CBRE Group Advisory leasing revenue by quarter