Filing Flows › Utilities › Berkshire Hathaway Energy
Berkshire Hathaway Energy earnings and revenue breakdown
Latest: Q2 2026 · 10-Q filed Aug 10, 2026
Q2 2026 Revenue up 5% year over year to $6.7B · 13¢ of every $1 of revenue kept as net profit · operating margin 19.1%
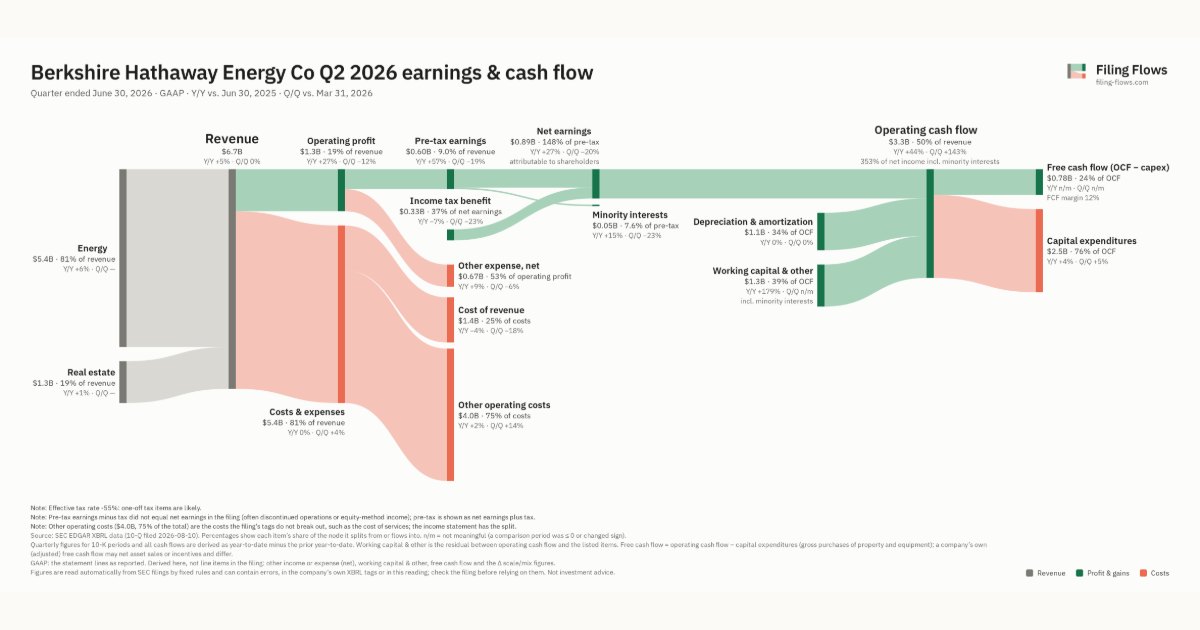
Berkshire Hathaway Energy made $6.7B in Q2 2026 (+5% Y/Y): Energy $5.4B, Real estate $1.3B. Operating margin 19.1%, net earnings $891M. See where every dollar goes — costs, profit and cash — as a Sankey from the 10-Q filed Aug 10, 2026.
Drawing the Sankey…
Open the interactive Sankey → click any line for what the company wrote about it, compare Y/Y and Q/Q, export as PNG or PDF
What changed this quarter
Revenue was $6.7B in Q2 2026, up 5% year over year and roughly flat from the previous quarter. Energy was the largest line at 81% of revenue. Energy added $0.28B year over year (up 6%), 97% of the total change.
Operating profit was $1.3B, a 19.1% margin (up 3.4 points year over year). Of the extra revenue versus Q2 2025, 94% reached operating profit, above the 16% margin then. Total costs grew 0% against revenue growth of 5%. Net earnings were $0.89B, up 27% year over year. The effective tax rate was -55.1%.
Operating cash flow was $3.3B (up 44% year over year), 353% of net income including minority interests. Non-cash charges added back $1.1B of depreciation and amortization. Working capital and other items added $1.2B. Capital expenditures of $2.5B left free cash flow of $0.78B.
Quarterly history
| Quarter | Form | Filed | Revenue | Y/Y | Op. margin | Net earnings | Op. cash flow |
|---|---|---|---|---|---|---|---|
| Q2 2026 | 10-Q | Aug 10, 2026 | $6.7B | +5% | 19.1% | $891M | $3.3B |
| Q1 2026 | 10-Q | May 4, 2026 | $6.7B | +5% | 21.9% | $1.1B | $1.4B |
| Q4 2025 | 10-K | Mar 2, 2026 | $6.2B | -0.1% | 15.5% | $691M | $1.4B |
| Q3 2025 | 10-Q | Nov 3, 2025 | $7.2B | +0.5% | 20.7% | $1.5B | $2.6B |
| Q2 2025 | 10-Q | Aug 4, 2025 | $6.4B | -0.2% | 15.7% | $702M | $2.3B |
| Q1 2025 | 10-Q | May 5, 2025 | $6.4B | +4% | 21.7% | $1.2B | $2.0B |
| Q4 2024 | 10-K | Feb 24, 2025 | $6.2B | +6% | 16.3% | $718M | $2.3B |
Charts
Interactive views
The same charts as the app — open one to draw it.
💵Where each $1 goesinteractive
Loading the interactive chart…
🌏Named in Asian annual reportsinteractive
Loading the interactive chart…
🏭Its industry’s money flow (input-output)interactive
Loading the interactive chart…
About Berkshire Hathaway Energy
BHE, a wholly owned subsidiary of Berkshire Hathaway, is a holding company headquartered in Iowa that has investments in a highly diversified portfolio of locally managed and operated businesses principally engaged in the energy industry. The Company's operations are organized as eight business segments: PacifiCorp, MidAmerican Funding (which primarily consists of MidAmerican Energy), NV Energy (which primarily consists of Nevada Power and Sierra Pacific), Northern Powergrid (which primarily consists of Northern Powergrid (Northeast) plc and Northern Powergrid (Yorkshire) plc), BHE Pipeline Group (which primarily consists of BHE GT&S, Northern Natural Gas and Kern River), BHE Transmission (which consists of BHE Canada (which primarily consists of AltaLink) and BHE U.S. Transmission), BHE Renewables and HomeServices.
In its own words, from its 10-K, filed Mar 2, 2026.
Berkshire Hathaway Energy against its Electric, Gas & Sanitary Services peers
The largest companies of the same SEC industry, each at its latest quarter.
| Company | Quarter | Revenue | Y/Y | Op. margin |
|---|---|---|---|---|
| Berkshire Hathaway Energy | Q2 2026 | $6.7B | +5% | 19.1% |
| MGEE MGE Energy | Q3 2026 | $190M | +8% | 30.5% |
Source: Berkshire Hathaway Energy 10-Q on SEC EDGAR · CIK 1081316 · Electric, Gas & Sanitary Services