Filing Flows › Energy › PBF Holding Co LLC
PBF Holding Co LLC earnings and revenue breakdown
Latest: Q2 2026 · 10-Q filed Aug 4, 2026
Q2 2026 Revenue up 56% year over year to $11.7B · 10¢ of every $1 of revenue kept as net profit · operating margin 10.2%
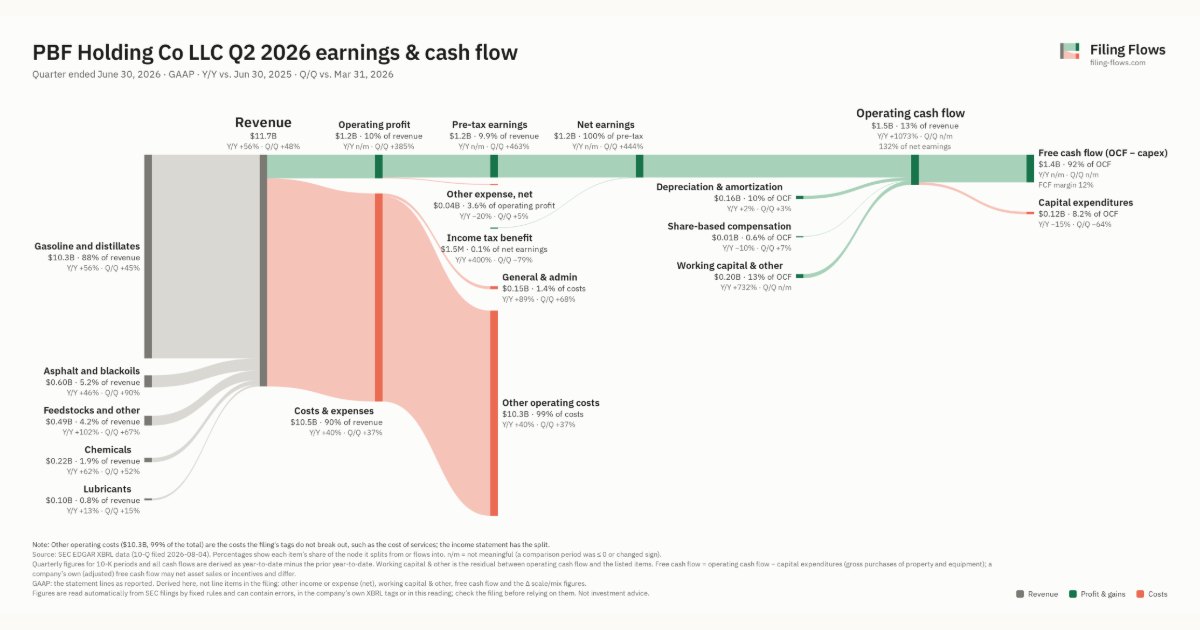
PBF Holding Co LLC made $11.7B in Q2 2026 (+56% Y/Y): Gasoline and distillates $10.3B, Asphalt and blackoils $605M, Feedstocks and other $487M. Operating margin 10.2%, net earnings $1.2B. See where every dollar goes — costs, profit and cash — as a Sankey from the 10-Q filed Aug 4, 2026.
Drawing the Sankey…
Open the interactive Sankey → click any line for what the company wrote about it, compare Y/Y and Q/Q, export as PNG or PDF
What changed this quarter
Revenue was $11.7B in Q2 2026, up 56% year over year and up 48% from the previous quarter. Gasoline and distillates was the largest line at 88% of revenue. Gasoline and distillates added $3.7B year over year (up 56%), 87% of the total change.
Operating profit was $1.2B, a 10.2% margin (up 10.3 points year over year). Total costs grew 40% against revenue growth of 56%. The fastest-growing cost line was General & admin (+89%). Net earnings were $1.2B. The effective tax rate was -0.1%.
Operating cash flow was $1.5B (up 1073% year over year), 132% of net earnings. Non-cash charges added back $0.16B of depreciation and amortization and $0.01B of share-based compensation. Working capital and other items added $0.20B. Capital expenditures of $0.12B left free cash flow of $1.4B.
Quarterly history
| Quarter | Form | Filed | Revenue | Y/Y | Op. margin | Net earnings | Op. cash flow |
|---|---|---|---|---|---|---|---|
| Q2 2026 | 10-Q | Aug 4, 2026 | $11.7B | +56% | 10.2% | $1.2B | $1.5B |
| Q1 2026 | 10-Q | May 4, 2026 | $7.9B | +12% | 3.1% | $212M | −$371M |
| Q4 2025 | 10-K | Feb 23, 2026 | $7.1B | -3% | 1.4% | $54.9M | $302M |
| Q3 2025 | 10-Q | Nov 4, 2025 | $7.6B | -9% | 2.1% | $103M | −$116M |
| Q2 2025 | 10-Q | Aug 5, 2025 | $7.5B | -14% | -0.1% | −$60.2M | $130M |
| Q1 2025 | 10-Q | May 6, 2025 | $7.1B | -18% | -7.7% | −$579M | −$590M |
| Q4 2024 | 10-K | Feb 25, 2025 | $7.3B | -20% | -5.8% | −$444M | −$392M |
Charts
Interactive views
The same charts as the app — open one to draw it.
💵Where each $1 goesinteractive
Loading the interactive chart…
🌏Named in Asian annual reportsinteractive
Loading the interactive chart…
🏭Its industry’s money flow (input-output)interactive
Loading the interactive chart…
Customers and suppliers named in filings
Sells to
- SHEL — 13% of its revenue · Stated in 10-K (name in text, share from XBRL) · source
About PBF Holding Co LLC
We are one of the largest independent petroleum refiners and suppliers of unbranded transportation fuels, heating oil, petrochemical feedstocks, lubricants and other petroleum products in the United States. We sell our products throughout the Northeast, Midwest, Gulf Coast and West Coast of the United States, as well as in other regions of the United States, Canada and Mexico and are able to ship products to other international destinations. We own and operate six domestic oil refineries and related assets. Our refineries have a combined processing capacity, known as throughput, of approximately 1,000,000 bpd, and a weighted-average Nelson Complexity Index of 12.8 based on current operating conditions.
In its own words, from its 10-K, filed Feb 23, 2026.
PBF Holding Co LLC against its Petroleum Refining peers
The largest companies of the same SEC industry, each at its latest quarter. Revenue growth: +56% against the peers' median +46%. Operating margin: 10.2% against the peers' median 18.7%.
| Company | Quarter | Revenue | Y/Y | Op. margin |
|---|---|---|---|---|
| PBF Holding Co LLC | Q2 2026 | $11.7B | +56% | 10.2% |
| XOM ExxonMobil Holdings | Q3 2026 | $113.2B | +33% | 18.8% |
| CVX Chevron | Q3 2026 | $67.8B | +36% | 20.1% |
| MPC Marathon Petroleum | Q3 2026 | $56.0B | +61% | 18.7% |
| PSX Phillips 66 | Q3 2026 | $50.5B | +46% | 14.1% |
| VLO Valero Energy | Q3 2026 | $46.1B | +43% | 19.7% |
| COP ConocoPhillips | Q3 2026 | $19.4B | +29% | 30.8% |
| SUNC SunocoCorp LLC | Q3 2026 | $18.0B | +199% | 4.1% |
| PBF PBF Energy | Q3 2026 | $12.1B | +59% | 17.3% |
Source: PBF Holding Co LLC 10-Q on SEC EDGAR · CIK 1566011 · Petroleum Refining