Filing Flows › Utilities › Cheniere Corpus Christi Holdings, LLC
Cheniere Corpus Christi Holdings, LLC earnings and revenue breakdown
Latest: Q3 2026 · 10-Q filed Oct 29, 2026
Q3 2026 Revenue up 84% year over year to $2.7B · 20¢ of every $1 of revenue kept as net profit · operating margin 21.2%
Cheniere Corpus Christi Holdings, LLC made $2.7B in Q3 2026 (+84% Y/Y). Operating margin 21.2%, net earnings $555M. See where every dollar goes — costs, profit and cash — as a Sankey from the 10-Q filed Oct 29, 2026.
Drawing the Sankey…
Open the interactive Sankey → click any line for what the company wrote about it, compare Y/Y and Q/Q, export as PNG or PDF
What changed this quarter
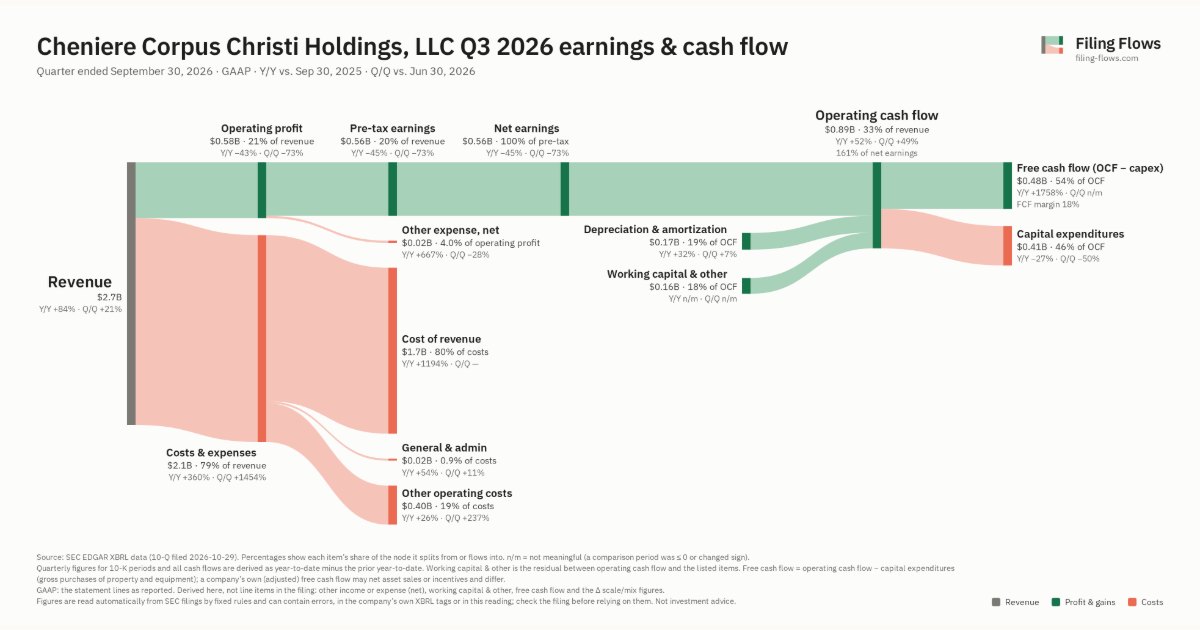
Revenue was $2.7B in Q3 2026, up 84% year over year and up 21% from the previous quarter.
Operating profit was $0.58B, a 21.2% margin (down 47.2 points year over year). Operating profit fell $0.43B even though revenue rose $1.2B versus Q3 2025, so costs grew faster than sales. Total costs grew 360% against revenue growth of 84%. The fastest-growing cost line was Cost of revenue (+1194%). Net earnings were $0.56B, down 45% year over year. The effective tax rate was 0.0%.
Operating cash flow was $0.89B (up 52% year over year), 161% of net earnings. Non-cash charges added back $0.17B of depreciation and amortization. Working capital and other items added $0.16B. Capital expenditures of $0.41B left free cash flow of $0.48B.
Quarterly history
| Quarter | Form | Filed | Revenue | Y/Y | Op. margin | Net earnings | Op. cash flow |
|---|---|---|---|---|---|---|---|
| Q3 2026 | 10-Q | Oct 29, 2026 | $2.7B | +84% | 21.2% | $555M | $892M |
| Q2 2026 | 10-Q | Aug 6, 2026 | $2.3B | +49% | 93.9% | $2.1B | $600M |
| Q1 2026 | 10-Q | May 7, 2026 | $2.6B | +63% | -122.4% | −$3.2B | $739M |
| Q4 2025 | 10-K | Feb 26, 2026 | $1.9B | +34% | 98.9% | $1.9B | $526M |
| Q3 2025 | 10-Q | Oct 30, 2025 | $1.5B | +21% | 68.5% | $1.0B | $585M |
| Q2 2025 | 10-Q | Aug 7, 2025 | $1.5B | +37% | 111.0% | $1.7B | $512M |
| Q1 2025 | 10-Q | May 8, 2025 | $1.6B | +42% | -18.2% | −$290M | $372M |
Charts
Interactive views
The same charts as the app — open one to draw it.
💵Where each $1 goesinteractive
Loading the interactive chart…
🌏Named in Asian annual reportsinteractive
Loading the interactive chart…
🏭Its industry’s money flow (input-output)interactive
Loading the interactive chart…
About Cheniere Corpus Christi Holdings, LLC
We own a natural gas liquefaction and export facility located near Corpus Christi, Texas (the “Corpus Christi LNG Terminal” ) through CCL, which has total expected production capacity of over 30 mtpa of LNG, inclusive of estimated debottlenecking opportunities, of which over 6 mtpa was under construction and the remainder was in operation as of June 30, 2026. The Corpus Christi LNG Terminal also has three LNG storage tanks and two marine berths. We also own an approximately 21 -mile natural gas supply pipeline that interconnects the Corpus Christi LNG Terminal with several large interstate and intrastate natural gas pipelines (the “Corpus Christi Pipeline” ).
In its own words, from its 10-Q, filed Aug 6, 2026.
Cheniere Corpus Christi Holdings, LLC against its Natural Gas Distribution peers
The largest companies of the same SEC industry, each at its latest quarter. Revenue growth: +84% against the peers' median +7%. Operating margin: 21.2% against the peers' median 31.0%.
| Company | Quarter | Revenue | Y/Y | Op. margin |
|---|---|---|---|---|
| Cheniere Corpus Christi Holdings, LLC | Q3 2026 | $2.7B | +84% | 21.2% |
| LNG Cheniere Energy | Q3 2026 | $6.2B | +39% | 31.0% |
| VG Venture Global | Q2 2026 | $4.6B | +48% | 47.8% |
| CQP Cheniere Energy Partners, L.P. | Q3 2026 | $2.6B | +7% | 31.7% |
| Sabine Pass Liquefaction, LLC | Q3 2026 | $2.5B | +7% | 29.4% |
| ATO Atmos Energy | Q3 FY26 | $879M | +5% | 36.4% |
| NFG National Fuel Gas | Q3 FY26 | $537M | +1% | 38.9% |
| SR Spire | Q3 FY26 | $420M | -0.4% | 5.6% |
| NJR New Jersey Resources | Q3 FY26 | $349M | +17% | 9.1% |
Source: Cheniere Corpus Christi Holdings, LLC 10-Q on SEC EDGAR · CIK 1693317 · Natural Gas Distribution