Filing Flows › Utilities › Venture Global (VG)
Venture Global (VG) earnings and revenue breakdown
Latest: Q2 2026 · 10-Q filed Aug 11, 2026 · Venture Global (VG) Q2 2026 earnings results →
Q2 2026 Revenue up 48% year over year to $4.6B · 29¢ of every $1 of revenue kept as net profit · operating margin 47.8%
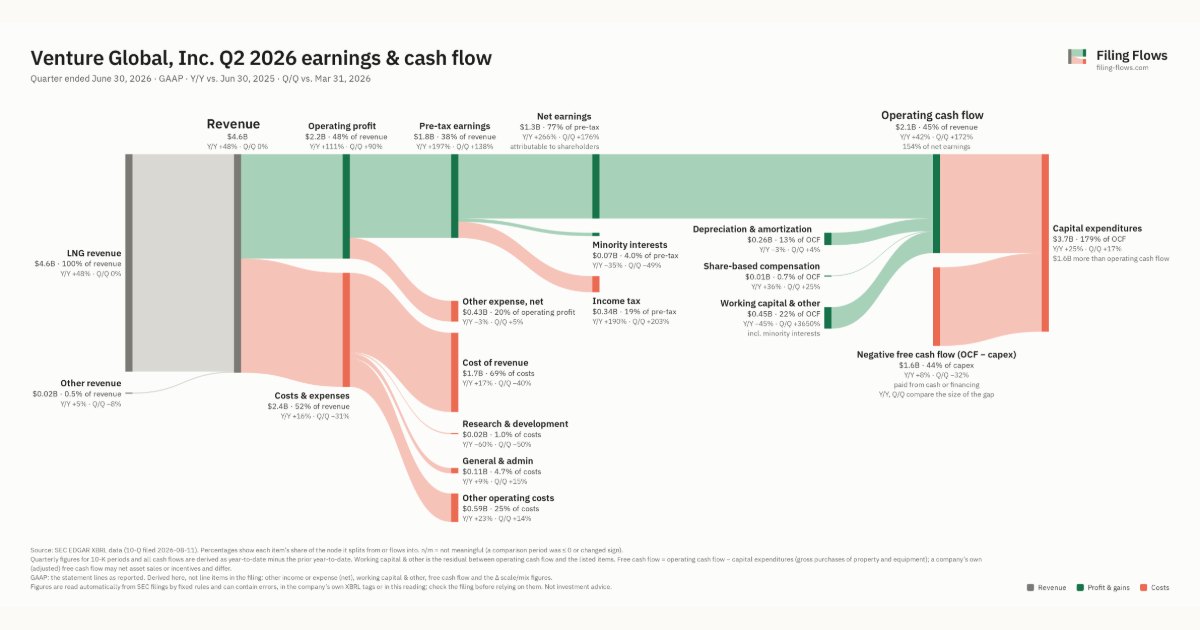
Venture Global made $4.6B in Q2 2026 (+48% Y/Y): LNG revenue $4.6B, Other revenue $22.0M. Operating margin 47.8%, net earnings $1.3B. See where every dollar goes — costs, profit and cash — as a Sankey from the 10-Q filed Aug 11, 2026.
Drawing the Sankey…
Open the interactive Sankey → click any line for what the company wrote about it, compare Y/Y and Q/Q, export as PNG or PDF
What changed this quarter
Revenue was $4.6B in Q2 2026, up 48% year over year and roughly flat from the previous quarter. LNG revenue was the largest line at 100% of revenue. LNG revenue added $1.5B year over year (up 48%), 100% of the total change.
Operating profit was $2.2B, a 47.8% margin (up 14.3 points year over year). Of the extra revenue versus Q2 2025, 78% reached operating profit, above the 33% margin then. Total costs grew 16% against revenue growth of 48%. The fastest-growing cost line was Other operating costs (+23%). Net earnings were $1.3B, up 266% year over year. The effective tax rate was 19.2%.
Operating cash flow was $2.1B (up 42% year over year), 146% of net income including minority interests. Non-cash charges added back $0.26B of depreciation and amortization and $0.01B of share-based compensation. Working capital and other items added $0.38B. Capital expenditures of $3.7B exceeded it, leaving free cash flow of −$1.6B.
Quarterly history
| Quarter | Form | Filed | Revenue | Y/Y | Op. margin | Net earnings | Op. cash flow |
|---|---|---|---|---|---|---|---|
| Q2 2026 | 10-Q | Aug 11, 2026 | $4.6B | +48% | 47.8% | $1.3B | $2.1B |
| Q1 2026 | 10-Q | May 12, 2026 | $4.6B | +59% | 25.0% | $488M | $763M |
| Q4 2025 | 10-K | Mar 2, 2026 | $4.4B | +192% | 38.7% | $1.1B | $2.1B |
| Q3 2025 | 10-Q | Nov 10, 2025 | $3.3B | +260% | 39.7% | $429M | $1.9B |
| Q2 2025 | 10-Q | Aug 12, 2025 | $3.1B | +180% | 33.5% | $368M | $1.5B |
| Q1 2025 | 10-Q | May 13, 2025 | $2.9B | +105% | 37.3% | $396M | $1.1B |
| Q4 2024 | 10-K | Mar 6, 2025 | $1.5B | — | 39.0% | $871M | $673M |
Charts
Interactive views
The same charts as the app — open one to draw it.
💵Where each $1 goesinteractive
Loading the interactive chart…
🌏Named in Asian annual reportsinteractive
Loading the interactive chart…
🔄Rotation against the market and its industry (RRG)interactive
Loading the interactive chart…
🔍Earnings qualityinteractive
Loading the interactive chart…
⚖️Fair value by methodinteractive
Loading the interactive chart…
🔭Outlook & guidanceinteractive
Loading the interactive chart…
📈Investments: gains and what it boughtinteractive
Loading the interactive chart…
🏭Its industry’s money flow (input-output)interactive
Loading the interactive chart…
Customers and suppliers named in filings
Buys from
About Venture Global
Venture Global is a long-term, low-cost provider of U.S. LNG sourced from resource rich North American natural gas basins. Our integrated assets span the LNG supply chain, including LNG production, natural gas transportation, shipping and regasification. Our innovative approach, which is both scalable and repeatable, allows us to bring low-cost LNG to a global market years faster than traditional LNG projects. We believe supplying this clean, affordable fuel promotes global energy security and diversification and is essential to meeting growing global energy demand.
In its own words, from its 10-K, filed Mar 2, 2026.
Venture Global against its Natural Gas Distribution peers
The largest companies of the same SEC industry, each at its latest quarter. Revenue growth: +48% against the peers' median +7%. Operating margin: 47.8% against the peers' median 31.0%.
| Company | Quarter | Revenue | Y/Y | Op. margin |
|---|---|---|---|---|
| VG Venture Global | Q2 2026 | $4.6B | +48% | 47.8% |
| LNG Cheniere Energy | Q3 2026 | $6.2B | +39% | 31.0% |
| Cheniere Corpus Christi Holdings, LLC | Q3 2026 | $2.7B | +84% | 21.2% |
| CQP Cheniere Energy Partners, L.P. | Q3 2026 | $2.6B | +7% | 31.7% |
| Sabine Pass Liquefaction, LLC | Q3 2026 | $2.5B | +7% | 29.4% |
| ATO Atmos Energy | Q3 FY26 | $879M | +5% | 36.4% |
| NFG National Fuel Gas | Q3 FY26 | $537M | +1% | 38.9% |
| SR Spire | Q3 FY26 | $420M | -0.4% | 5.6% |
| NJR New Jersey Resources | Q3 FY26 | $349M | +17% | 9.1% |
Source: Venture Global 10-Q on SEC EDGAR · CIK 2007855 · Natural Gas Distribution
13F: who owns VG and who is buying
More on VG
- How Venture Global makes money: revenue by segment
- Venture Global next earnings date and what analysts expect
- Venture Global stock forecast, price target and fair value
- Who owns Venture Global stock: holders, funds and Congress trades
- Is Venture Global a takeover target? LBO and rumors
- Venture Global recalls, complaints and regulation
History
Every quarter: Q2 2026 results · Q1 2026 results · Q4 2025 results · Q3 2025 results · Q2 2025 results · Q1 2025 results · Q4 2024 results