Filing Flows › Financials › Deere John Capital
Deere John Capital earnings and revenue breakdown
Latest: Q3 FY26 · 10-Q filed Aug 27, 2026
Q3 FY26 Revenue down 3% year over year to $1.2B · 15¢ of every $1 of revenue kept as net profit · operating margin 18.0%
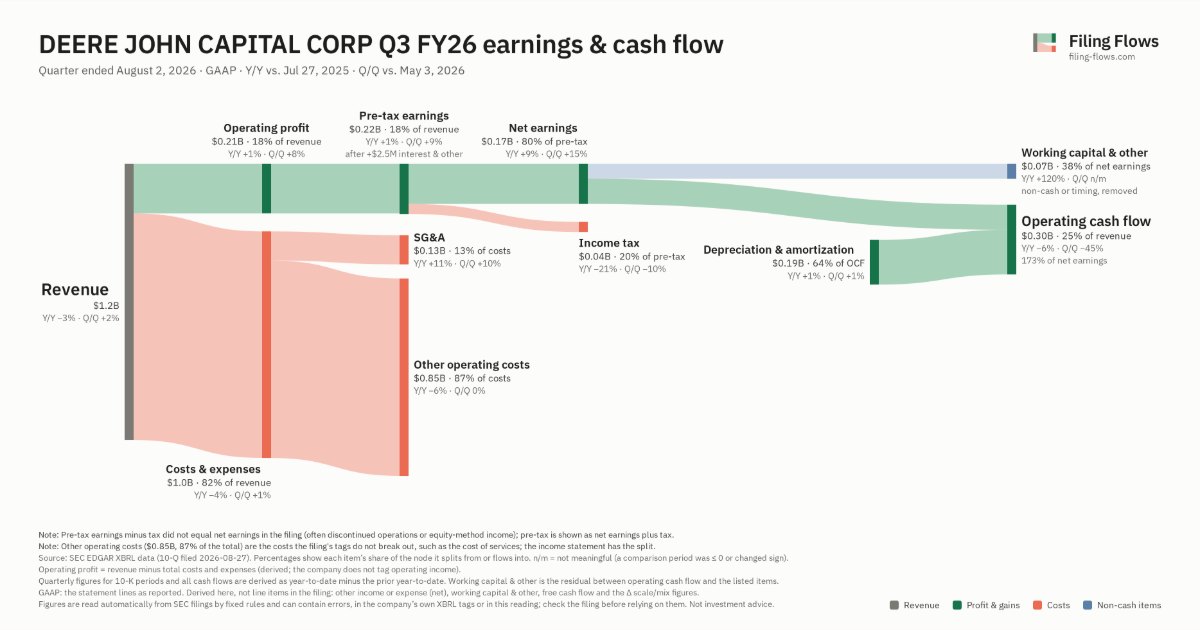
Deere John Capital made $1.2B in Q3 FY26 (-3% Y/Y). Operating margin 18.0%, net earnings $174M. See where every dollar goes — costs, profit and cash — as a Sankey from the 10-Q filed Aug 27, 2026.
Drawing the Sankey…
Open the interactive Sankey → click any line for what the company wrote about it, compare Y/Y and Q/Q, export as PNG or PDF
What changed this quarter
Revenue was $1.2B in Q3 FY26, down 3% year over year and up 2% from the previous quarter.
Operating profit was $0.21B, a 18.0% margin (up 0.7 points year over year). Total costs fell 4% while revenue fell 3%. The fastest-growing cost line was SG&A (+11%). Net earnings were $0.17B, up 9% year over year. The effective tax rate was 19.9%.
Operating cash flow was $0.30B (down 6% year over year), 173% of net earnings. Non-cash charges added back $0.19B of depreciation and amortization. Working capital and other items used $0.07B.
Quarterly history
| Quarter | Form | Filed | Revenue | Y/Y | Op. margin | Net earnings | Op. cash flow |
|---|---|---|---|---|---|---|---|
| Q3 FY26 | 10-Q | Aug 27, 2026 | $1.2B | -3% | 18.0% | $174M | $301M |
| Q2 FY26 | 10-Q | May 28, 2026 | $1.2B | -2% | 17.0% | $151M | $542M |
| Q1 FY26 | 10-Q | Feb 26, 2026 | $1.2B | -3% | 21.2% | $199M | $348M |
| Q4 FY25 | 10-K | Dec 18, 2025 | $1.3B | +1% | 25.4% | $261M | $533M |
| Q3 FY25 | 10-Q | Aug 28, 2025 | $1.2B | -4% | 17.3% | $159M | $320M |
| Q2 FY25 | 10-Q | May 29, 2025 | $1.2B | -0.8% | 13.6% | $124M | $512M |
| Q4 FY24 | 10-K | Dec 12, 2024 | $1.3B | +12% | 15.6% | $158M | $393M |
Charts
Interactive views
The same charts as the app — open one to draw it.
💵Where each $1 goesinteractive
Loading the interactive chart…
🌏Named in Asian annual reportsinteractive
Loading the interactive chart…
🏭Its industry’s money flow (input-output)interactive
Loading the interactive chart…
Customers and suppliers named in filings
Buys from
About Deere John Capital
This Annual Report on Form 10-K contains forward-looking statements that are subject to risks and uncertainties. All statements other than statements of historical fact included in this Annual Report on Form 10-K are forward-looking statements. Forward-looking statements provide our current expectations and projections relating to our financial condition, results of operations, plans, objectives, future performance, and business. You can identify forward-looking statements as they do not relate to historical or current facts and by words such as “believe,” “expect,” “estimate,” “anticipate,” “will,” “aim,” “should,” “plan,” “forecast,” “target,” “guide,” “project,” “intend,” “could,” and similar words or expressions.
In its own words, from its 10-K, filed Dec 18, 2025.
Deere John Capital against its Short-Term Business Credit Institutions peers
The largest companies of the same SEC industry, each at its latest quarter. Revenue growth: -3% against the peers' median +5%. Operating margin: 18.0% against the peers' median 30.0%.
| Company | Quarter | Revenue | Y/Y | Op. margin |
|---|---|---|---|---|
| Deere John Capital | Q3 FY26 | $1.2B | -3% | 18.0% |
| ECPG Encore Capital Group | Q3 2026 | $545M | +18% | 42.3% |
| PRAA PRA Group | Q3 2026 | $286M | -8% | 30.0% |
| Paccar Financial | Q3 2026 | $235M | -0.3% | 25.6% |
| JCAP Jefferson Capital | Q2 2026 | $178M | +16% | 45.9% |
| PLBC Plumas Bancorp | Q3 2026 | $29.3M | +7% | 47.8% |
| SWRD Stewards | Q2 2026 | $3.5M | +5% | -114.5% |
Source: Deere John Capital 10-Q on SEC EDGAR · CIK 27673 · Short-Term Business Credit Institutions