Filing Flows › Financials › HSBC USA
HSBC USA earnings and revenue breakdown
Latest: Q3 2026 · 10-Q filed Oct 27, 2026
Q3 2026 Revenue down 2% year over year to $1.1B · 27¢ of every $1 of revenue kept as net profit · operating margin 98.1%
HSBC USA made $1.1B in Q3 2026 (-2% Y/Y). Operating margin 98.1%, net earnings $310M. See where every dollar goes — costs, profit and cash — as a Sankey from the 10-Q filed Oct 27, 2026.
Drawing the Sankey…
Open the interactive Sankey → click any line for what the company wrote about it, compare Y/Y and Q/Q, export as PNG or PDF
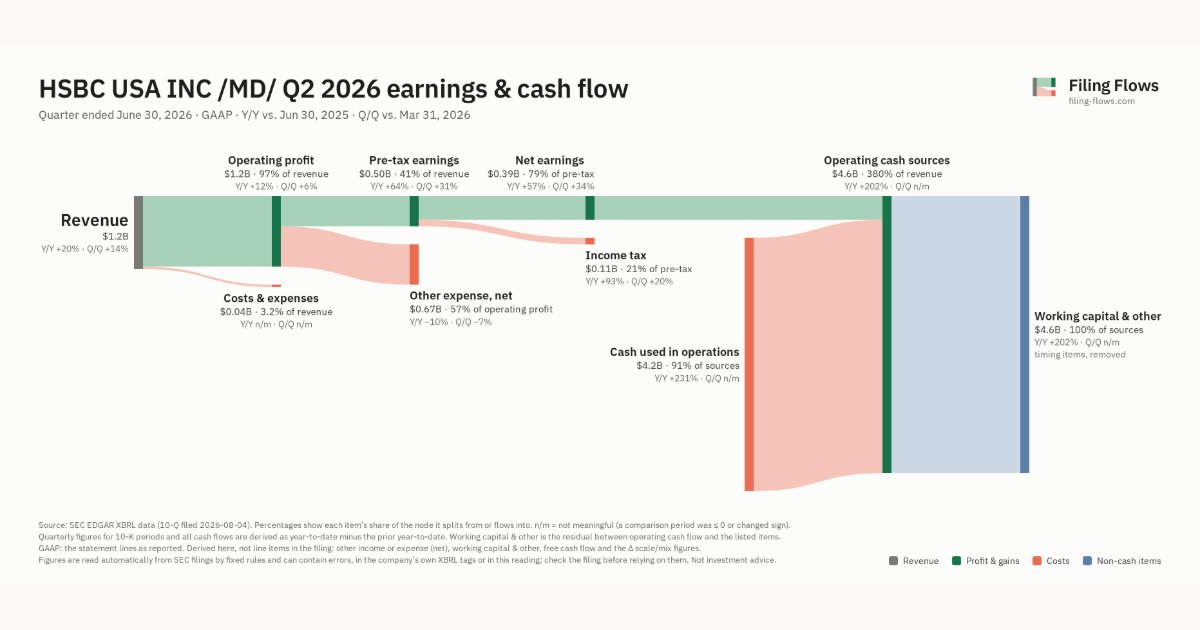
What changed this quarter
Revenue was $1.1B in Q3 2026, down 3% year over year and down 6% from the previous quarter.
Operating profit was $1.1B, a 98.1% margin (up 5.4 points year over year). Total costs fell 75% while revenue fell 3%. Net earnings were $0.31B, down 18% year over year. The effective tax rate was 24.0%.
Operating cash flow was −$6.3B. Working capital and other items used $6.6B.
Quarterly history
| Quarter | Form | Filed | Revenue | Y/Y | Op. margin | Net earnings | Op. cash flow |
|---|---|---|---|---|---|---|---|
| Q3 2026 | 10-Q | Oct 27, 2026 | $1.1B | -2% | 98.1% | $310M | −$6.3B |
| Q2 2026 | 10-Q | Aug 4, 2026 | $1.2B | +20% | 96.8% | $390M | −$4.2B |
| Q1 2026 | 10-Q | May 5, 2026 | $1.0B | +13% | 104.6% | $291M | $1.4B |
| Q4 2025 | 10-K | Feb 25, 2026 | $1.0B | -5% | 101.7% | $274M | −$2.3B |
| Q3 2025 | 10-Q | Oct 28, 2025 | $1.2B | +47% | 92.7% | $378M | $443M |
Charts
Interactive views
The same charts as the app — open one to draw it.
💵Where each $1 goesinteractive
Loading the interactive chart…
🌏Named in Asian annual reportsinteractive
Loading the interactive chart…
🏭Its industry’s money flow (input-output)interactive
Loading the interactive chart…
About HSBC USA
HSBC USA Inc. ("HSBC USA") is incorporated under the laws of the State of Maryland and is a wholly-owned subsidiary of HSBC North America Holdings Inc. ("HSBC North America"), which is an indirect wholly-owned subsidiary of HSBC Holdings plc ("HSBC" and, together with its subsidiaries, "HSBC Group"). HSBC USA's principal business is to act as a holding company for its subsidiaries. In this Form 10-K, HSBC USA and its subsidiaries are referred to as "HUSI," "we," "us" and "our." HSBC Group's ambition is to be the most trusted bank globally, putting customers at the heart of everything it does. HSBC Group helps meet its customers' financial needs and support them to achieve their goals with its products and services, while navigating the complexities of the global market through its deep international network, supported with the stability and strength of its balance sheet.
In its own words, from its 10-K, filed Feb 25, 2026.
HSBC USA against its National Commercial Banks peers
The largest companies of the same SEC industry, each at its latest quarter. Revenue growth: -2% against the peers' median +6%. Operating margin: 98.1% against the peers' median 32.5%.
| Company | Quarter | Revenue | Y/Y | Op. margin |
|---|---|---|---|---|
| HSBC USA | Q3 2026 | $1.1B | -2% | 98.1% |
| JPM JPMorgan Chase | Q3 2026 | $50.2B | +8% | 40.1% |
| BAC Bank of America | Q3 2026 | $30.0B | +3% | 29.9% |
| C Citigroup | Q3 2026 | $23.8B | +8% | 30.6% |
| WFC Wells Fargo | Q3 2026 | $21.9B | +2% | 32.5% |
| COF Capital One Financial | Q3 2026 | $16.3B | +6% | 28.0% |
| USB US Bancorp | Q3 2026 | $8.0B | +9% | 35.1% |
| PNC PNC Financial Services Group | Q3 2026 | $6.6B | +11% | 40.0% |
| TFC Truist Financial | Q3 2026 | $3.7B | -28% | 23.9% |
Source: HSBC USA 10-Q on SEC EDGAR · CIK 83246 · National Commercial Banks