Filing Flows › Industrials › Cornerstone Building Brands
Cornerstone Building Brands earnings and revenue breakdown
Latest: Q2 2026 · 10-Q filed Aug 18, 2026
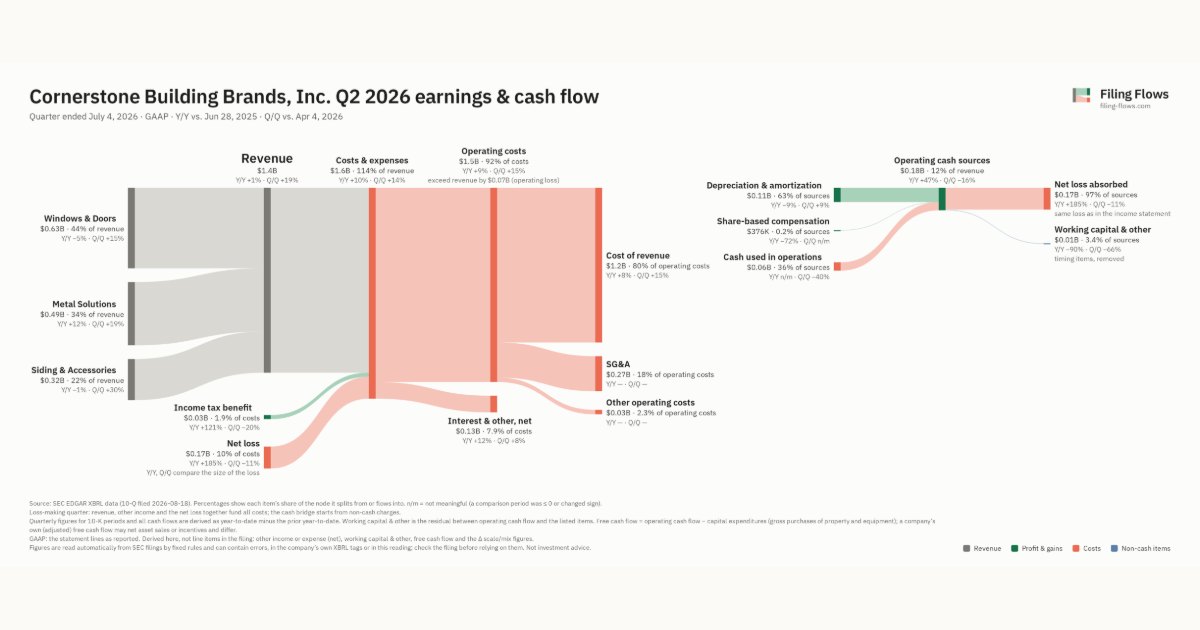
Q2 2026 Revenue up 1% year over year to $1.4B · 12¢ of every $1 of revenue lost · operating margin -5.0%
Cornerstone Building Brands made $1.4B in Q2 2026 (+1% Y/Y): Windows & Doors $629M, Metal Solutions $493M, Siding & Accessories $321M. Operating margin -5.0%, net loss $171M. See where every dollar goes — costs, profit and cash — as a Sankey from the 10-Q filed Aug 18, 2026.
Drawing the Sankey…
Open the interactive Sankey → click any line for what the company wrote about it, compare Y/Y and Q/Q, export as PNG or PDF
What changed this quarter
Revenue was $1.4B in Q2 2026, up 1% year over year and up 19% from the previous quarter. Windows & Doors was the largest line at 44% of revenue. Metal Solutions added $0.05B year over year (up 12%), 352% of the total change. Windows & Doors declined 5%.
Gross margin was 16.3%, down 5.5 points from Q2 2025. Operating costs exceeded revenue by $0.07B, an operating margin of -5.0%. Operating expenses grew 14% against revenue growth of 1%. The quarter ended with a net loss of $0.17B, narrower than the previous quarter's $0.19B loss. Net interest and other expense of $0.13B was the main reason.
Operating cash flow was −$0.06B. Non-cash charges added back $0.11B of depreciation and amortization and $376K of share-based compensation. Working capital and other items used $0.01B. Capital expenditures of $0.04B exceeded it, leaving free cash flow of −$0.10B.
Quarterly history
| Quarter | Form | Filed | Revenue | Y/Y | Op. margin | Net earnings | Op. cash flow |
|---|---|---|---|---|---|---|---|
| Q2 2026 | 10-Q | Aug 18, 2026 | $1.4B | +1% | -5.0% | −$171M | −$64.5M |
| Q1 2026 | 10-Q | May 8, 2026 | $1.2B | +3% | -9.2% | −$193M | −$108M |
| Q4 2025 | 10-K | Mar 12, 2026 | $1.4B | +0.5% | -6.9% | −$176M | $97.5M |
| Q3 2025 | 10-Q | Nov 7, 2025 | $1.4B | +0.8% | -24.5% | −$356M | $15.9M |
| Q2 2025 | 10-Q | Aug 5, 2025 | $1.4B | +5% | 3.0% | −$60.0M | $3.9M |
| Q1 2025 | 10-Q | May 13, 2025 | $1.2B | +3% | -1.6% | −$111M | −$136M |
| Q4 2024 | 10-K | Mar 14, 2025 | $1.4B | +7% | -38.4% | −$587M | $193M |
Charts
Interactive views
The same charts as the app — open one to draw it.
💵Where each $1 goesinteractive
Loading the interactive chart…
🌏Named in Asian annual reportsinteractive
Loading the interactive chart…
🏭Its industry’s money flow (input-output)interactive
Loading the interactive chart…
About Cornerstone Building Brands
Cornerstone Building Brands, Inc. (“Cornerstone Building Brands”, together with its subsidiaries, unless the context requires otherwise, the “Company,” “we,” “us” or “our”) is a holding company incorporated in the State of Delaware. We are a leading manufacturer of exterior building products in North America and serve residential and commercial customers across both the new construction and repair and remodel markets. Our operations are organized as three reportable segments: Windows & Doors, Siding & Accessories, and Metal Solutions. We have:
In its own words, from its 10-K, filed Mar 12, 2026.
Source: Cornerstone Building Brands 10-Q on SEC EDGAR · CIK 883902 · Prefabricated Metal Buildings & Components