Filing Flows › Financials › Metropolitan Life Insurance
Metropolitan Life Insurance earnings and revenue breakdown
Latest: Q2 2026 · 10-Q filed Aug 11, 2026
Q2 2026 Revenue up 2% year over year to $9.6B · 5¢ of every $1 of revenue kept as net profit · operating margin 6.0%
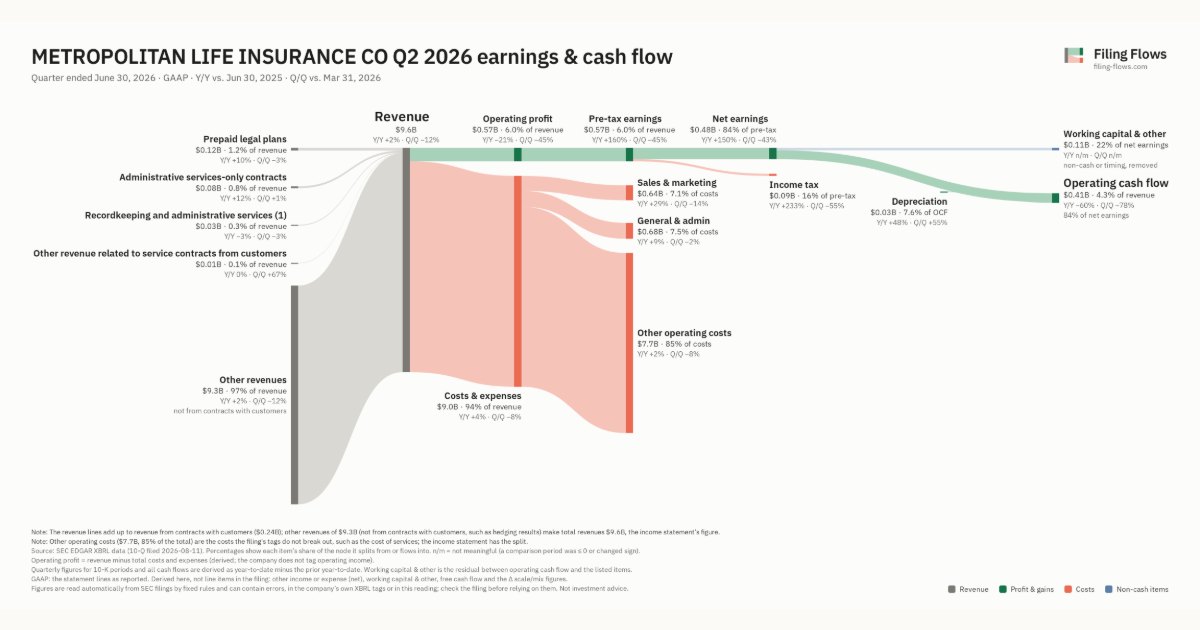
Metropolitan Life Insurance made $9.6B in Q2 2026 (+2% Y/Y). Operating margin 6.0%, net earnings $485M. See where every dollar goes — costs, profit and cash — as a Sankey from the 10-Q filed Aug 11, 2026.
Drawing the Sankey…
Open the interactive Sankey → click any line for what the company wrote about it, compare Y/Y and Q/Q, export as PNG or PDF
What changed this quarter
Revenue was $9.6B in Q2 2026, up 2% year over year and down 12% from the previous quarter.
Operating profit was $0.57B, a 6.0% margin (down 1.8 points year over year). Operating profit fell $0.16B even though revenue rose $0.22B versus Q2 2025, so costs grew faster than sales. Total costs grew 4% against revenue growth of 2%. The fastest-growing cost line was Sales & marketing (+29%). Net earnings were $0.49B, up 148% year over year. The effective tax rate was 15.7%.
Operating cash flow was $0.41B (down 60% year over year), 84% of net earnings. Non-cash charges added back $0.03B of depreciation. Working capital and other items used $0.11B.
Quarterly history
| Quarter | Form | Filed | Revenue | Y/Y | Op. margin | Net earnings | Op. cash flow |
|---|---|---|---|---|---|---|---|
| Q2 2026 | 10-Q | Aug 11, 2026 | $9.6B | +2% | 6.0% | $485M | $409M |
| Q1 2026 | 10-Q | May 12, 2026 | $10.8B | +8% | 9.7% | $856M | $1.9B |
| Q4 2025 | 10-K | Mar 11, 2026 | $14.6B | +24% | 4.2% | $513M | $5.6B |
| Q3 2025 | 10-Q | Nov 12, 2025 | $9.3B | -0.5% | 9.9% | $517M | $777M |
| Q2 2025 | 10-Q | Aug 12, 2025 | $9.3B | -15% | 7.8% | $194M | $1.0B |
| Q1 2025 | 10-Q | May 6, 2025 | $10.1B | +4% | 8.7% | $335M | $1.6B |
| Q4 2024 | 10-K | Mar 11, 2025 | $11.8B | +24% | 7.6% | $1.6B | $2.7B |
Charts
Interactive views
The same charts as the app — open one to draw it.
💵Where each $1 goesinteractive
Loading the interactive chart…
🌏Named in Asian annual reportsinteractive
Loading the interactive chart…
🏭Its industry’s money flow (input-output)interactive
Loading the interactive chart…
Customers and suppliers named in filings
Buys from
About Metropolitan Life Insurance
As used in this Form 10-K, “MLIC,” the “Company,” “we,” “our” and “us” refer to Metropolitan Life Insurance Company, a New York corporation incorporated in 1868, and its subsidiaries. Metropolitan Life Insurance Company is a wholly-owned subsidiary of MetLife, Inc. (MetLife, Inc., together with its subsidiaries and affiliates, “MetLife”). The Company is a provider of insurance, annuities and employee benefits. We are also one of the largest institutional investors in the United States (“U.S.”) with a general account portfolio invested primarily in fixed income securities (corporate, structured products, municipals, and government and agency) and mortgage loans, as well as real estate, real estate joint ventures (“REJVs”) and other limited partnerships.
In its own words, from its 10-K, filed Mar 11, 2026.
Metropolitan Life Insurance against its Life Insurance peers
The largest companies of the same SEC industry, each at its latest quarter. Revenue growth: +2% against the peers' median +8%. Operating margin: 6.0% against the peers' median 11.4%.
| Company | Quarter | Revenue | Y/Y | Op. margin |
|---|---|---|---|---|
| Metropolitan Life Insurance | Q2 2026 | $9.6B | +2% | 6.0% |
| MET Metlife | Q3 2026 | $20.5B | +18% | 8.9% |
| PRU Prudential Financial | Q3 2026 | $14.4B | -19% | 11.4% |
| RGA Reinsurance Group of America | Q3 2026 | $7.5B | +22% | 8.3% |
| CRBG Corebridge Financial | Q3 2026 | $6.2B | +14% | 37.7% |
| LNC Lincoln National | Q3 2026 | $5.5B | +20% | 31.7% |
| Lincoln National Life Insurance | Q2 2026 | $4.3B | +8% | 25.2% |
| ATH-PA Athene Holding | Q3 2026 | $3.1B | -62% | -56.7% |
| VOYA Voya Financial | Q3 2026 | $2.0B | -5% | 14.2% |
Source: Metropolitan Life Insurance 10-Q on SEC EDGAR · CIK 937834 · Life Insurance