Filing Flows › Financials › Prudential Financial (PRU)
Prudential Financial (PRU) earnings and revenue breakdown
Latest: Q3 2026 · 10-Q filed Nov 4, 2026 · Prudential Financial (PRU) Q3 2026 earnings results →
Q3 2026 Revenue down 19% year over year to $14.4B · 10¢ of every $1 of revenue kept as net profit · operating margin 11.4%
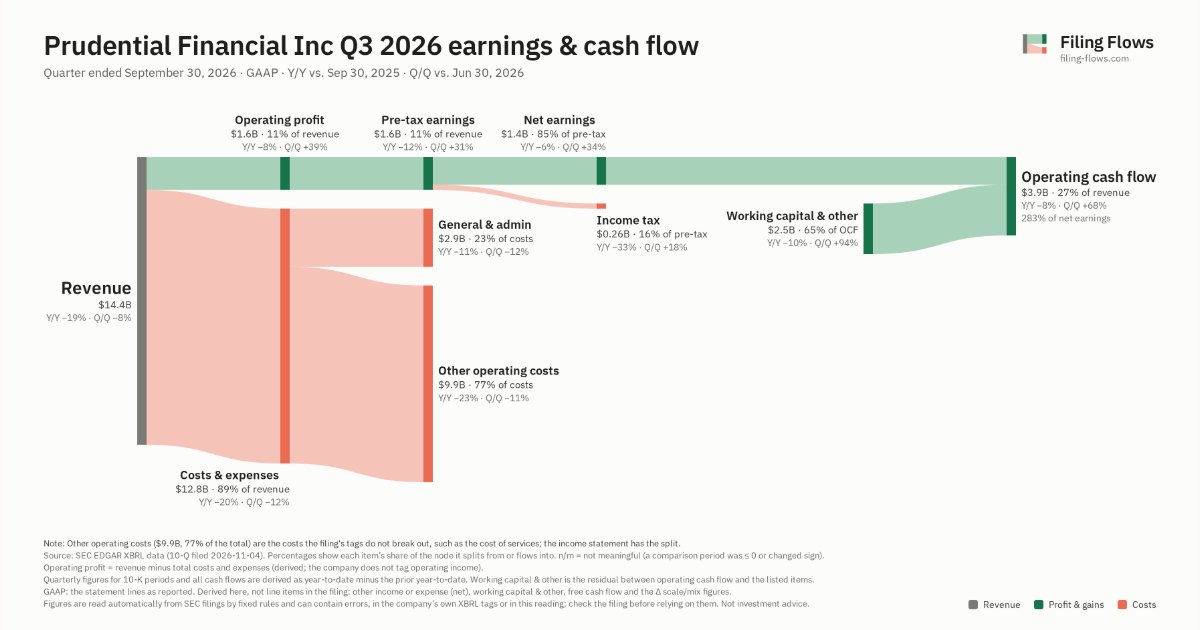
Prudential Financial made $14.4B in Q3 2026 (-19% Y/Y). Operating margin 11.4%, net earnings $1.4B. See where every dollar goes — costs, profit and cash — as a Sankey from the 10-Q filed Nov 4, 2026.
Drawing the Sankey…
Open the interactive Sankey → click any line for what the company wrote about it, compare Y/Y and Q/Q, export as PNG or PDF
What changed this quarter
Revenue was $14.4B in Q3 2026, down 19% year over year and down 8% from the previous quarter.
Operating profit was $1.6B, a 11.4% margin (up 1.4 points year over year). Total costs fell 20% while revenue fell 19%. Net earnings were $1.4B, down 3% year over year. The effective tax rate was 15.7%.
Operating cash flow was $3.9B (down 8% year over year), 283% of net earnings. Working capital and other items added $2.5B.
Quarterly history
| Quarter | Form | Filed | Revenue | Y/Y | Op. margin | Net earnings | Op. cash flow |
|---|---|---|---|---|---|---|---|
| Q3 2026 | 10-Q | Nov 4, 2026 | $14.4B | -19% | 11.4% | $1.4B | $3.9B |
| Q2 2026 | 10-Q | Aug 5, 2026 | $15.7B | +14% | 7.5% | $985M | $2.3B |
| Q1 2026 | 10-Q | May 6, 2026 | $15.5B | +15% | 4.7% | $597M | $1.0B |
| Q4 2025 | 10-K | Feb 12, 2026 | $15.7B | +25% | 7.7% | $905M | $3.3B |
| Q3 2025 | 10-Q | Oct 30, 2025 | $17.9B | -8% | 10.0% | $1.4B | $4.3B |
| Q2 2025 | 10-Q | Jul 31, 2025 | $13.7B | -8% | 5.4% | $533M | $1.2B |
| Q1 2025 | 10-Q | May 1, 2025 | $13.5B | -43% | 6.8% | $707M | −$2.5B |
Charts
Interactive views
The same charts as the app — open one to draw it.
💵Where each $1 goesinteractive
Loading the interactive chart…
🌏Named in Asian annual reportsinteractive
Loading the interactive chart…
🔄Rotation against the market and its industry (RRG)interactive
Loading the interactive chart…
🔍Earnings qualityinteractive
Loading the interactive chart…
⚖️Fair value by methodinteractive
Loading the interactive chart…
🔭Outlook & guidanceinteractive
Loading the interactive chart…
📈Investments: gains and what it boughtinteractive
Loading the interactive chart…
🏭Its industry’s money flow (input-output)interactive
Loading the interactive chart…
About Prudential Financial
Prudential Financial, Inc. (“Prudential Financial” or “PFI”), a global financial services leader and premier active global investment manager with approximately $1.609 trillion of assets under management as of December 31, 2025, has operations in the United States, Asia, Europe and Latin America. Through our subsidiaries and affiliates we offer a wide array of financial products and services, including life insurance, annuities, retirement-related products and services, mutual funds and investment management. We offer these products and services to individual and institutional customers through proprietary and third-party distribution networks. Our principal executive offices are located in Newark, New Jersey, and Prudential Financial’s Common Stock is publicly traded on the New York Stock Exchange under the ticker symbol “PRU.”
In its own words, from its 10-K, filed Feb 12, 2026.
Prudential Financial against its Life Insurance peers
The largest companies of the same SEC industry, each at its latest quarter. Revenue growth: -19% against the peers' median +8%. Operating margin: 11.4% against the peers' median 11.4%.
| Company | Quarter | Revenue | Y/Y | Op. margin |
|---|---|---|---|---|
| PRU Prudential Financial | Q3 2026 | $14.4B | -19% | 11.4% |
| MET Metlife | Q3 2026 | $20.5B | +18% | 8.9% |
| Metropolitan Life Insurance | Q2 2026 | $9.6B | +2% | 6.0% |
| RGA Reinsurance Group of America | Q3 2026 | $7.5B | +22% | 8.3% |
| CRBG Corebridge Financial | Q3 2026 | $6.2B | +14% | 37.7% |
| LNC Lincoln National | Q3 2026 | $5.5B | +20% | 31.7% |
| Lincoln National Life Insurance | Q2 2026 | $4.3B | +8% | 25.2% |
| ATH-PA Athene Holding | Q3 2026 | $3.1B | -62% | -56.7% |
| VOYA Voya Financial | Q3 2026 | $2.0B | -5% | 14.2% |
Source: Prudential Financial 10-Q on SEC EDGAR · CIK 1137774 · Life Insurance
Guidance and outlook
13F: who owns PRU and who is buying
More on PRU
- How Prudential Financial makes money: revenue by segment
- Prudential Financial next earnings date and what analysts expect
- Prudential Financial stock forecast, price target and fair value
- Who owns Prudential Financial stock: holders, funds and Congress trades
- Prudential Financial guidance and outlook
- Prudential Financial recalls, complaints and regulation
History
Every quarter: Q3 2026 results · Q2 2026 results · Q1 2026 results · Q4 2025 results · Q3 2025 results · Q2 2025 results · Q1 2025 results