Filing Flows › Industrials › Core & Main (CNM)
Core & Main (CNM) earnings and revenue breakdown
Latest: Q2 FY27 · 10-Q filed Sep 9, 2026 · Core & Main (CNM) Q2 FY27 earnings results →
Q2 FY27 Revenue up 2% year over year to $2.1B · 7¢ of every $1 of revenue kept as net profit · operating margin 10.6%
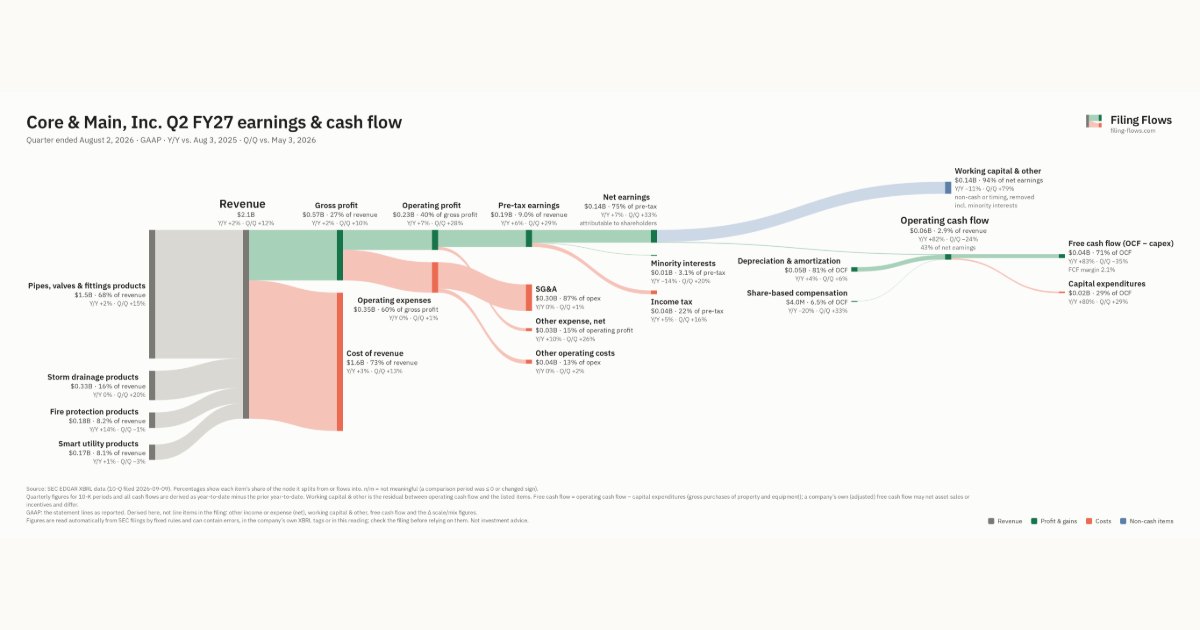
Core & Main made $2.1B in Q2 FY27 (+2% Y/Y): Pipes, valves & fittings products $1.5B, Storm drainage products $334M, Fire protection products $176M. Operating margin 10.6%, net earnings $144M. See where every dollar goes — costs, profit and cash — as a Sankey from the 10-Q filed Sep 9, 2026.
Drawing the Sankey…
Open the interactive Sankey → click any line for what the company wrote about it, compare Y/Y and Q/Q, export as PNG or PDF
What changed this quarter
Revenue was $2.1B in Q2 FY27, up 2% year over year and up 12% from the previous quarter. Pipes, valves & fittings products was the largest line at 68% of revenue. Pipes, valves & fittings products added $0.03B year over year (up 2%), 60% of the total change.
Gross margin was 26.7%, unchanged from Q2 FY26. Operating profit was $0.23B, a 10.6% margin (up 0.4 points year over year). Of the extra revenue versus Q2 FY26, 27% reached operating profit, above the 10% margin then. Operating expenses fell 0% while revenue rose 2%. Net earnings were $0.14B, up 7% year over year. The effective tax rate was 22.3%.
Operating cash flow was $0.06B (up 82% year over year), 41% of net income including minority interests. Non-cash charges added back $0.05B of depreciation and amortization and $4.0M of share-based compensation. Working capital and other items used $0.14B. Capital expenditures of $0.02B left free cash flow of $0.04B.
Quarterly history
| Quarter | Form | Filed | Revenue | Y/Y | Op. margin | Net earnings | Op. cash flow |
|---|---|---|---|---|---|---|---|
| Q2 FY27 | 10-Q | Sep 9, 2026 | $2.1B | +2% | 10.6% | $144M | $62.0M |
| Q1 FY27 | 10-Q | Jun 10, 2026 | $1.9B | -0.1% | 9.3% | $108M | $82.0M |
| Q4 FY26 | 10-K | Mar 24, 2026 | $1.6B | -7% | 7.5% | $70.0M | $268M |
| Q3 FY26 | 10-Q | Dec 9, 2025 | $2.1B | +1% | 10.7% | $137M | $271M |
| Q2 FY26 | 10-Q | Sep 9, 2025 | $2.1B | +7% | 10.2% | $134M | $34.0M |
| Q1 FY26 | 10-Q | Jun 10, 2025 | $1.9B | +10% | 8.9% | $100M | $77.0M |
| Q4 FY25 | 10-K | Mar 25, 2025 | $1.7B | +18% | 7.3% | $64.0M | $235M |
Charts
Interactive views
The same charts as the app — open one to draw it.
💵Where each $1 goesinteractive
Loading the interactive chart…
🌏Named in Asian annual reportsinteractive
Loading the interactive chart…
🔄Rotation against the market and its industry (RRG)interactive
Loading the interactive chart…
🔍Earnings qualityinteractive
Loading the interactive chart…
⚖️Fair value by methodinteractive
Loading the interactive chart…
🔭Outlook & guidanceinteractive
Loading the interactive chart…
📈Investments: gains and what it boughtinteractive
Loading the interactive chart…
🏭Its industry’s money flow (input-output)interactive
Loading the interactive chart…
Customers and suppliers named in filings
Buys from
About Core & Main
Core & Main, Inc. (“Core & Main” and collectively with its subsidiaries, the “Company,” “we,” “our” or “us”) is a holding company and its primary material assets are its direct and indirect ownership interest in Core & Main Holdings, LP, a Delaware limited partnership (“Holdings”), and deferred tax assets associated with this ownership. Core & Main is a leading specialty distributor dedicated to advancing reliable infrastructure with local service, nationwide. With a focus on water, wastewater, storm drainage and fire protection products, and related services, we provide solutions to municipalities, private water companies and professional contractors across municipal, non- residential and residential end markets.
In its own words, from its 10-K, filed Mar 24, 2026.
Core & Main against its Wholesale-Durable Goods, NEC peers
The largest companies of the same SEC industry, each at its latest quarter. Revenue growth: +2% against the peers' median +2%. Operating margin: 10.6% against the peers' median -1.5%.
| Company | Quarter | Revenue | Y/Y | Op. margin |
|---|---|---|---|---|
| CNM Core & Main | Q2 FY27 | $2.1B | +2% | 10.6% |
| AENT Alliance Entertainment Holding | Q4 FY26 | $268M | +18% | -1.5% |
| BGMS Bio Green Med Solution | Q2 2026 | $357K | — | -117.1% |
| GNLN Greenlane Holdings | Q2 2026 | $82K | -90% | n/m |
Source: Core & Main 10-Q on SEC EDGAR · CIK 1856525 · Wholesale-Durable Goods, NEC
Guidance and outlook
13F: who owns CNM and who is buying
More on CNM
History
Every quarter: Q2 FY27 results · Q1 FY27 results · Q4 FY26 results · Q3 FY26 results · Q2 FY26 results · Q1 FY26 results · Q4 FY25 results
- Core & Main guidance history: guided vs reported
- Core & Main gross margin by quarter
- Core & Main operating margin by quarter
- Core & Main net income by quarter
- Core & Main free cash flow by quarter
- Core & Main capital expenditures by quarter
- Core & Main Pipes, valves & fittings products revenue by quarter
- Core & Main Storm drainage products revenue by quarter
- Core & Main Fire protection products revenue by quarter