Filing Flows › Technology › Epam Systems (EPAM)
Epam Systems (EPAM) earnings and revenue breakdown
Latest: Q3 2026 · 10-Q filed Nov 5, 2026 · Epam Systems (EPAM) Q3 2026 earnings results →
Q3 2026 Revenue up 2% year over year to $1.4B · 9¢ of every $1 of revenue kept as net profit · operating margin 12.3%
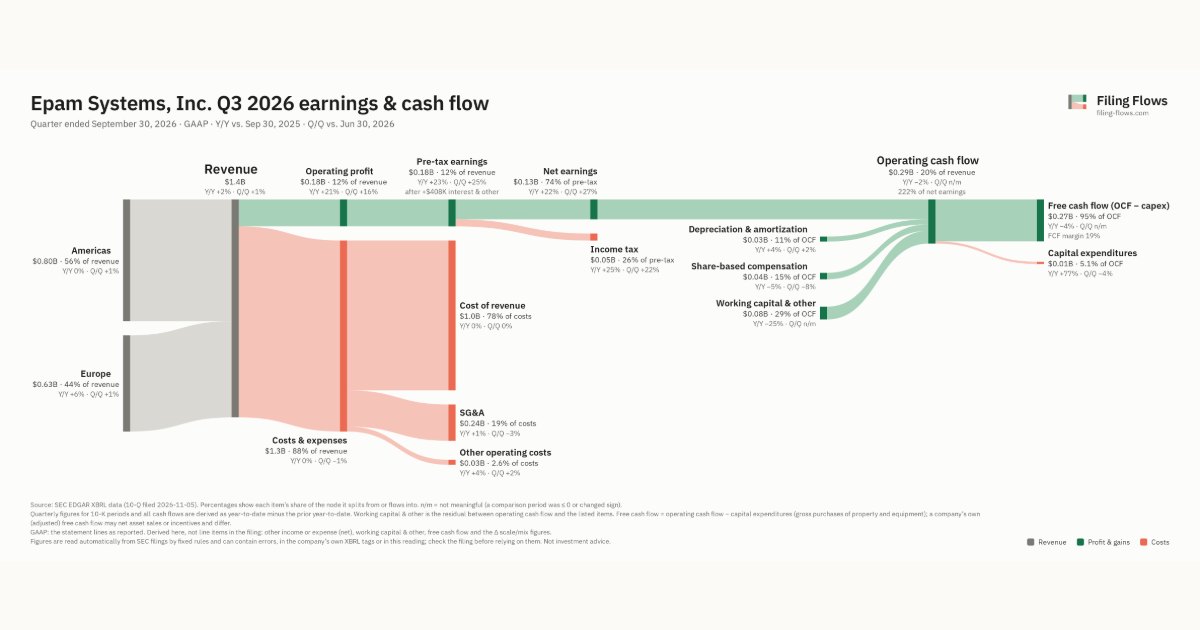
Epam Systems made $1.4B in Q3 2026 (+2% Y/Y): Americas $797M, Europe $630M. Operating margin 12.3%, net earnings $130M. See where every dollar goes — costs, profit and cash — as a Sankey from the 10-Q filed Nov 5, 2026.
Drawing the Sankey…
Open the interactive Sankey → click any line for what the company wrote about it, compare Y/Y and Q/Q, export as PNG or PDF
What changed this quarter
Revenue was $1.4B in Q3 2026, up 2% year over year and up 1% from the previous quarter. Americas was the largest line at 56% of revenue. Europe added $0.04B year over year (up 6%), 110% of the total change.
Operating profit was $0.18B, a 12.3% margin (up 1.9 points year over year). Of the extra revenue versus Q3 2025, 97% reached operating profit, above the 10% margin then. Total costs grew 0% against revenue growth of 2%. Net earnings were $0.13B, up 22% year over year. The effective tax rate was 26.1%.
Operating cash flow was $0.29B (down 2% year over year), 222% of net earnings. Non-cash charges added back $0.03B of depreciation and amortization and $0.04B of share-based compensation. Working capital and other items added $0.08B. Capital expenditures of $0.01B left free cash flow of $0.27B.
Quarterly history
| Quarter | Form | Filed | Revenue | Y/Y | Op. margin | Net earnings | Op. cash flow |
|---|---|---|---|---|---|---|---|
| Q3 2026 | 10-Q | Nov 5, 2026 | $1.4B | +2% | 12.3% | $130M | $289M |
| Q2 2026 | 10-Q | Aug 6, 2026 | $1.4B | +4% | 10.8% | $103M | −$2.4M |
| Q1 2026 | 10-Q | May 7, 2026 | $1.4B | +8% | 8.3% | $82.5M | −$36.4M |
| Q4 2025 | 10-K | Feb 26, 2026 | $1.4B | +13% | 10.6% | $109M | $283M |
| Q3 2025 | 10-Q | Nov 6, 2025 | $1.4B | +19% | 10.4% | $107M | $295M |
| Q2 2025 | 10-Q | Aug 7, 2025 | $1.4B | +18% | 9.3% | $88.0M | $53.2M |
| Q1 2025 | 10-Q | May 8, 2025 | $1.3B | +12% | 7.6% | $73.5M | $24.2M |
Charts
Interactive views
The same charts as the app — open one to draw it.
💵Where each $1 goesinteractive
Loading the interactive chart…
🌏Named in Asian annual reportsinteractive
Loading the interactive chart…
🔄Rotation against the market and its industry (RRG)interactive
Loading the interactive chart…
🔍Earnings qualityinteractive
Loading the interactive chart…
⚖️Fair value by methodinteractive
Loading the interactive chart…
🔭Outlook & guidanceinteractive
Loading the interactive chart…
📈Investments: gains and what it boughtinteractive
Loading the interactive chart…
🏭Its industry’s money flow (input-output)interactive
Loading the interactive chart…
About Epam Systems
EPAM has used its software engineering expertise to become a leading global provider of digital engineering, cloud and artificial intelligence-enabled transformation services, and a leading business and experience consulting partner for global enterprises and ambitious start-ups. We address our clients’ transformation challenges by fusing EPAM Continuum’s integrated strategy, experience and technology consulting with our 30+ years of engineering execution to speed our clients’ time to market and drive greater value from their innovations and digital investments.
In its own words, from its 10-K, filed Feb 26, 2026.
Epam Systems against its Services-Computer Programming Services peers
The largest companies of the same SEC industry, each at its latest quarter. Revenue growth: +2% against the peers' median +6%. Operating margin: 12.3% against the peers' median 12.3%.
| Company | Quarter | Revenue | Y/Y | Op. margin |
|---|---|---|---|---|
| EPAM Epam Systems | Q3 2026 | $1.4B | +2% | 12.3% |
| CTSH Cognizant Technology Solutions | Q3 2026 | $5.7B | +5% | 15.4% |
| ZS Zscaler | Q4 FY26 | $898M | +25% | -1.7% |
| VRSN VeriSign | Q3 2026 | $443M | +6% | 66.9% |
| RDNW RideNow Group | Q2 2026 | $297M | -1% | 6.0% |
| DOCS Doximity | Q2 FY27 | $175M | +4% | 25.2% |
| XTIA XTI Aerospace | Q2 2026 | $32.4M | — | -28.0% |
| IA Innovative Solutions & Support | Q3 FY26 | $26.7M | +11% | 22.6% |
| NIXX Nixxy | Q2 2026 | $16.1M | +20% | -10.1% |
Source: Epam Systems 10-Q on SEC EDGAR · CIK 1352010 · Services-Computer Programming Services
Guidance and outlook
13F: who owns EPAM and who is buying
More on EPAM
- How Epam Systems makes money: revenue by segment
- Epam Systems next earnings date and what analysts expect
- Epam Systems stock forecast, price target and fair value
- Who owns Epam Systems stock: holders, funds and Congress trades
- Epam Systems guidance and outlook
- Is Epam Systems a takeover target? LBO and rumors
History
Every quarter: Q3 2026 results · Q2 2026 results · Q1 2026 results · Q4 2025 results · Q3 2025 results · Q2 2025 results · Q1 2025 results