Filing Flows › Utilities › Enterprise Products Partners L.P. (EPD)
Enterprise Products Partners L.P. (EPD) earnings and revenue breakdown
Latest: Q3 2026 · 10-Q filed Nov 4, 2026 · Enterprise Products Partners L.P. (EPD) Q3 2026 earnings results →
Q3 2026 Revenue up 49% year over year to $17.9B · 9¢ of every $1 of revenue kept as net profit · operating margin 11.1%
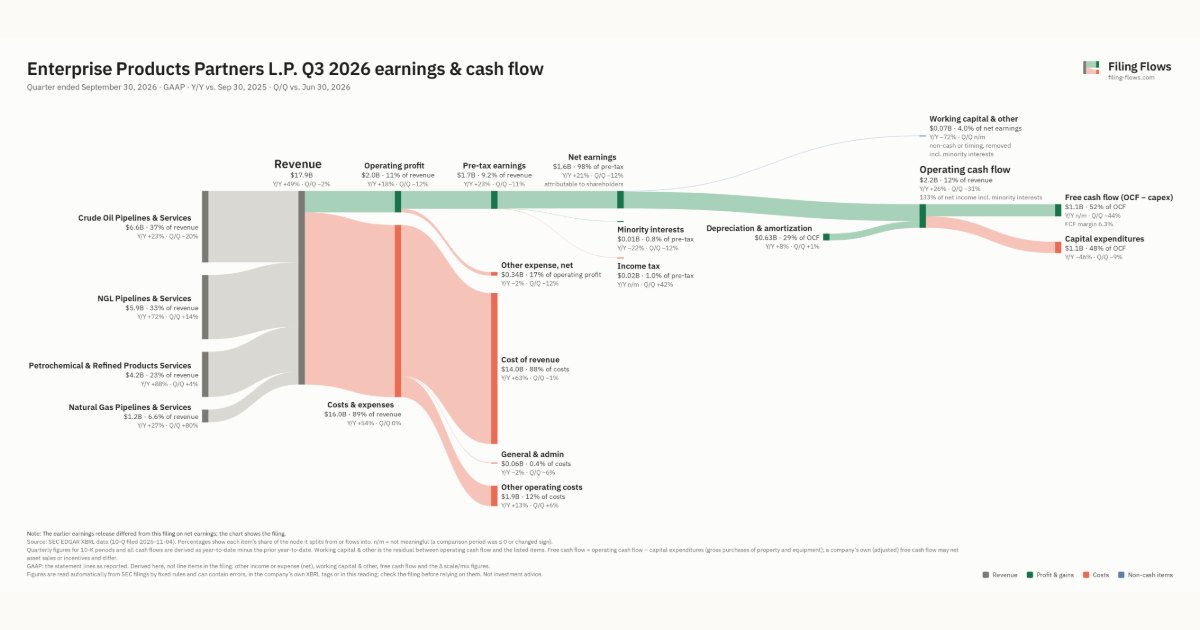
Enterprise Products Partners L.P. made $17.9B in Q3 2026 (+49% Y/Y): Crude Oil Pipelines & Services $6.6B, NGL Pipelines & Services $5.9B, Petrochemical & Refined Products Services $4.2B. Operating margin 11.1%, net earnings $1.6B. See where every dollar goes — costs, profit and cash — as a Sankey from the 10-Q filed Nov 4, 2026.
Drawing the Sankey…
Open the interactive Sankey → click any line for what the company wrote about it, compare Y/Y and Q/Q, export as PNG or PDF
What changed this quarter
Revenue was $17.9B in Q3 2026, up 49% year over year and down 2% from the previous quarter. Crude Oil Pipelines & Services was the largest line at 37% of revenue. NGL Pipelines & Services added $2.5B year over year (up 72%), 42% of the total change.
Operating profit was $2.0B, a 11.1% margin (down 2.9 points year over year). Of the extra revenue versus Q3 2025, 5% reached operating profit, below the 14% margin then. Total costs grew 54% against revenue growth of 49%. The fastest-growing cost line was Cost of revenue (+63%). Net earnings were $1.6B, up 21% year over year. The effective tax rate was 1.0%.
Operating cash flow was $2.2B (up 26% year over year), 133% of net earnings. Non-cash charges added back $0.63B of depreciation and amortization. Capital expenditures of $1.1B left free cash flow of $1.1B.
Quarterly history
| Quarter | Form | Filed | Revenue | Y/Y | Op. margin | Net earnings | Op. cash flow |
|---|---|---|---|---|---|---|---|
| Q3 2026 | 10-Q | Nov 4, 2026 | $17.9B | +49% | 11.1% | $1.6B | $2.2B |
| Q2 2026 | 10-Q | Aug 7, 2026 | $18.3B | +61% | 12.3% | $1.8B | $3.2B |
| Q1 2026 | 10-Q | May 7, 2026 | $14.4B | -7% | 13.2% | $1.5B | $1.5B |
| Q4 2025 | 10-K | Feb 27, 2026 | $13.8B | -3% | 14.7% | $1.6B | $2.5B |
| Q3 2025 | 10-Q | Nov 6, 2025 | $12.0B | -13% | 14.0% | $1.3B | $1.7B |
| Q2 2025 | 10-Q | Aug 8, 2025 | $11.4B | -16% | 15.8% | $1.4B | $2.1B |
| Q1 2025 | 10-Q | May 7, 2025 | $15.4B | +4% | 11.4% | $1.4B | $2.3B |
Charts
Interactive views
The same charts as the app — open one to draw it.
💵Where each $1 goesinteractive
Loading the interactive chart…
🌏Named in Asian annual reportsinteractive
Loading the interactive chart…
🔄Rotation against the market and its industry (RRG)interactive
Loading the interactive chart…
🔍Earnings qualityinteractive
Loading the interactive chart…
⚖️Fair value by methodinteractive
Loading the interactive chart…
🔭Outlook & guidanceinteractive
Loading the interactive chart…
📈Investments: gains and what it boughtinteractive
Loading the interactive chart…
🏭Its industry’s money flow (input-output)interactive
Loading the interactive chart…
Customers and suppliers named in filings
Buys from
- CRGY — 12% of the supplier’s revenue · Stated in 10-K (XBRL) · source
- MTDR · Stated in 10-K (named, share not stated) · source
About Enterprise Products Partners L.P.
We are a publicly traded Delaware limited partnership, the common units of which are listed on the New York Stock Exchange (“NYSE”) under the ticker symbol “EPD.” Our preferred units are not publicly traded. We were formed in April 1998 to own and operate certain natural gas liquids (“NGLs”) related businesses of EPCO and are a leading North American provider of midstream energy services to producers and consumers of natural gas, NGLs, crude oil, petrochemicals and refined products. We are owned by our limited partners (preferred and common unitholders) from an economic perspective. Enterprise GP, which owns a non-economic general partner interest in us, manages our Partnership. We conduct substantially all of our business operations through EPO and its consolidated subsidiaries.
In its own words, from its 10-Q, filed Aug 7, 2026.
Enterprise Products Partners L.P. against its Natural Gas Transmission peers
The largest companies of the same SEC industry, each at its latest quarter. Revenue growth: +49% against the peers' median +30%. Operating margin: 11.1% against the peers' median 24.1%.
| Company | Quarter | Revenue | Y/Y | Op. margin |
|---|---|---|---|---|
| EPD Enterprise Products Partners L.P. | Q3 2026 | $17.9B | +49% | 11.1% |
| ET Energy Transfer LP | Q3 2026 | $37.1B | +86% | 7.5% |
| TRGP Targa Resources | Q3 2026 | $5.6B | +35% | 19.6% |
| KMI Kinder Morgan | Q3 2026 | $4.5B | +9% | 25.6% |
| Northwest Pipeline LLC | Q3 2026 | $3.2B | +10% | 35.2% |
| Western Midstream Operating, LP | Q2 2026 | $1.2B | +30% | 43.0% |
| WES Western Midstream Partners, LP | Q3 2026 | $1.2B | +25% | 38.6% |
| NGL NGL Energy Partners LP | Q2 FY27 | $987M | +46% | 2.4% |
| Boardwalk Pipeline Partners, LP | Q3 2026 | $614M | +13% | 24.1% |
Source: Enterprise Products Partners L.P. 10-Q on SEC EDGAR · CIK 1061219 · Natural Gas Transmission
Guidance and outlook
13F: who owns EPD and who is buying
More on EPD
- How Enterprise Products Partners L.P. makes money: revenue by segment
- Enterprise Products Partners L.P. next earnings date and what analysts expect
- Enterprise Products Partners L.P. stock forecast, price target and fair value
- Who owns Enterprise Products Partners L.P. stock: holders, funds and Congress trades
- Enterprise Products Partners L.P. guidance and outlook
- Is Enterprise Products Partners L.P. a takeover target? LBO and rumors
History
Every quarter: Q3 2026 results · Q2 2026 results · Q1 2026 results · Q4 2025 results · Q3 2025 results · Q2 2025 results · Q1 2025 results
- Enterprise Products Partners L.P. guidance history: guided vs reported
- Enterprise Products Partners L.P. operating margin by quarter
- Enterprise Products Partners L.P. net income by quarter
- Enterprise Products Partners L.P. free cash flow by quarter
- Enterprise Products Partners L.P. capital expenditures by quarter
- Enterprise Products Partners L.P. Crude Oil Pipelines & Services revenue by quarter
- Enterprise Products Partners L.P. NGL Pipelines & Services revenue by quarter
- Enterprise Products Partners L.P. Petrochemical & Refined Products Services revenue by quarter