Filing Flows › Energy › Crescent Energy (CRGY)
Crescent Energy (CRGY) earnings and revenue breakdown
Latest: Q3 2026 · 10-Q filed Nov 2, 2026 · Crescent Energy (CRGY) Q3 2026 earnings results →
Q3 2026 Revenue up 56% year over year to $1.4B · 0¢ of every $1 of revenue lost · operating margin 35.4%
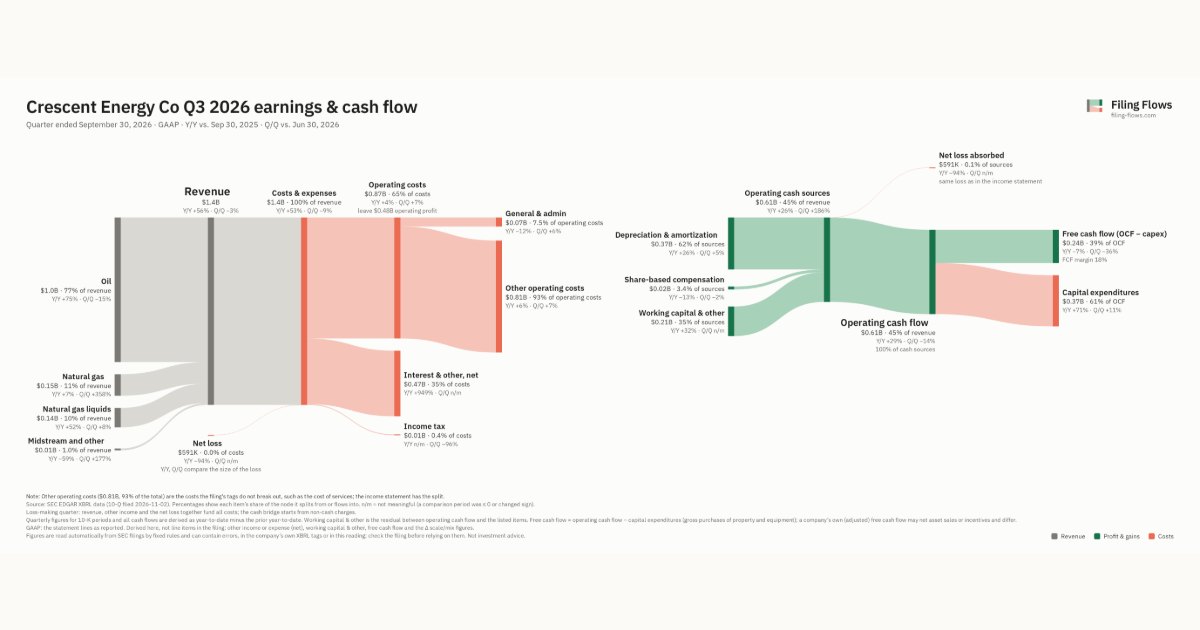
Crescent Energy made $1.4B in Q3 2026 (+56% Y/Y): Oil $1.0B, Natural gas $155M, Natural gas liquids $140M. Operating margin 35.4%, net loss $591K. See where every dollar goes — costs, profit and cash — as a Sankey from the 10-Q filed Nov 2, 2026.
Drawing the Sankey…
Open the interactive Sankey → click any line for what the company wrote about it, compare Y/Y and Q/Q, export as PNG or PDF
What changed this quarter
Revenue was $1.4B in Q3 2026, up 56% year over year and down 3% from the previous quarter. Oil was the largest line at 77% of revenue. Oil added $0.45B year over year (up 75%), 92% of the total change. Midstream and other declined 59%.
Operating profit was $0.48B, a 35.4% margin (up 31.9 points year over year). Of the extra revenue versus Q3 2025, 92% reached operating profit, above the 4% margin then. Total costs grew 4% against revenue growth of 56%. The quarter ended with a net loss of $591K, after a profit of $0.49B the previous quarter. Net interest and other expense of $0.47B was the main reason.
Operating cash flow was $0.61B (up 29% year over year). Non-cash charges added back $0.37B of depreciation and amortization and $0.02B of share-based compensation. Working capital and other items added $0.21B. Capital expenditures of $0.37B left free cash flow of $0.24B.
Quarterly history
| Quarter | Form | Filed | Revenue | Y/Y | Op. margin | Net earnings | Op. cash flow |
|---|---|---|---|---|---|---|---|
| Q3 2026 | 10-Q | Nov 2, 2026 | $1.4B | +56% | 35.4% | −$591K | $608M |
| Q2 2026 | 10-Q | Aug 3, 2026 | $1.4B | +55% | 41.6% | $493M | $707M |
| Q1 2026 | 10-Q | May 4, 2026 | $1.2B | +24% | 27.7% | −$419M | $409M |
| Q4 2025 | 10-K | Feb 25, 2026 | $865M | -1% | -6.2% | $9.0M | $371M |
| Q3 2025 | 10-Q | Nov 3, 2025 | $867M | +16% | 3.6% | −$10.3M | $473M |
| Q2 2025 | 10-Q | Aug 4, 2025 | $898M | +38% | 8.9% | $153M | $499M |
| Q1 2025 | 10-Q | May 5, 2025 | $950M | +44% | 18.1% | $5.9M | $337M |
Charts
Interactive views
The same charts as the app — open one to draw it.
💵Where each $1 goesinteractive
Loading the interactive chart…
🌏Named in Asian annual reportsinteractive
Loading the interactive chart…
🔄Rotation against the market and its industry (RRG)interactive
Loading the interactive chart…
🔍Earnings qualityinteractive
Loading the interactive chart…
⚖️Fair value by methodinteractive
Loading the interactive chart…
🔭Outlook & guidanceinteractive
Loading the interactive chart…
📈Investments: gains and what it boughtinteractive
Loading the interactive chart…
🏭Its industry’s money flow (input-output)interactive
Loading the interactive chart…
Customers and suppliers named in filings
Sells to
About Crescent Energy
Crescent is a differentiated energy company committed to delivering value through a disciplined, returns-driven growth through acquisition strategy and consistent return of capital. Our long-life, balanced portfolio combines significant cash flow from stable production with deep, high-quality development inventory. Our activities are focused in the Eagle Ford, Permian and Uinta Basins, and we own minerals and royalty interests across premier U.S. oil and natural gas basins, primarily operated by large, well-capitalized companies, with a core focus in the Eagle Ford. For additional information, please visit www.crescentenergyco.com.
In its own words, from its 8-K, filed Aug 3, 2026.
Crescent Energy against its Crude Petroleum & Natural Gas peers
The largest companies of the same SEC industry, each at its latest quarter. Revenue growth: +56% against the peers' median +52%. Operating margin: 35.4% against the peers' median 33.7%.
| Company | Quarter | Revenue | Y/Y | Op. margin |
|---|---|---|---|---|
| CRGY Crescent Energy | Q3 2026 | $1.4B | +56% | 35.4% |
| EOG EOG Resources | Q3 2026 | $8.5B | +46% | 41.9% |
| OXY Occidental Petroleum | Q2 2026 | $8.1B | +53% | 48.5% |
| DVN Devon Energy | Q3 2026 | $6.9B | +58% | 18.3% |
| FANG Diamondback Energy | Q3 2026 | $5.4B | +38% | 46.0% |
| EXE Expand Energy | Q3 2026 | $3.3B | +11% | 19.5% |
| PARR PAR Pacific Holdings | Q3 2026 | $3.1B | +52% | 15.5% |
| OVV Ovintiv | Q3 2026 | $2.6B | +26% | 33.7% |
| SM SM Energy | Q3 2026 | $2.2B | +167% | 10.9% |
Source: Crescent Energy 10-Q on SEC EDGAR · CIK 1866175 · Crude Petroleum & Natural Gas
Guidance and outlook
13F: who owns CRGY and who is buying
More on CRGY
- How Crescent Energy makes money: revenue by segment
- Crescent Energy next earnings date and what analysts expect
- Crescent Energy stock forecast, price target and fair value
- Who owns Crescent Energy stock: holders, funds and Congress trades
- Crescent Energy guidance and outlook
- Is Crescent Energy a takeover target? LBO and rumors
History
Every quarter: Q3 2026 results · Q2 2026 results · Q1 2026 results · Q4 2025 results · Q3 2025 results · Q2 2025 results · Q1 2025 results
- Crescent Energy operating margin by quarter
- Crescent Energy net income by quarter
- Crescent Energy free cash flow by quarter
- Crescent Energy capital expenditures by quarter
- Crescent Energy Oil revenue by quarter
- Crescent Energy Natural gas revenue by quarter
- Crescent Energy Natural gas liquids revenue by quarter