Filing Flows › Energy › SM Energy (SM)
SM Energy (SM) earnings and revenue breakdown
Latest: Q3 2026 · 10-Q filed Nov 4, 2026 · SM Energy (SM) Q3 2026 earnings results →
Q3 2026 Revenue up 167% year over year to $2.2B · 4¢ of every $1 of revenue kept as net profit · operating margin 10.9%
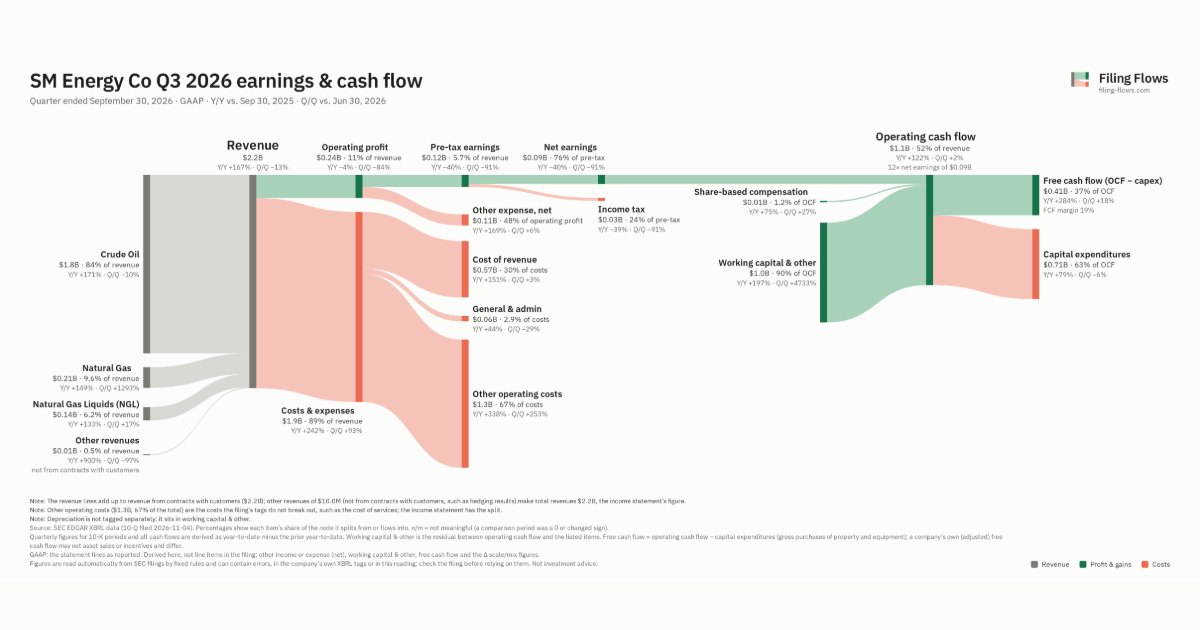
SM Energy made $2.2B in Q3 2026 (+167% Y/Y): Crude Oil $1.8B, Natural Gas $209M, Natural Gas Liquids (NGL) $135M. Operating margin 10.9%, net earnings $93.0M. See where every dollar goes — costs, profit and cash — as a Sankey from the 10-Q filed Nov 4, 2026.
Drawing the Sankey…
Open the interactive Sankey → click any line for what the company wrote about it, compare Y/Y and Q/Q, export as PNG or PDF
What changed this quarter
Revenue was $2.2B in Q3 2026, up 167% year over year and down 13% from the previous quarter. Crude Oil was the largest line at 84% of revenue. Crude Oil added $1.1B year over year (up 171%), 84% of the total change.
Operating profit was $0.24B, a 10.9% margin (down 19.4 points year over year). Operating profit fell $0.01B even though revenue rose $1.4B versus Q3 2025, so costs grew faster than sales. Total costs grew 242% against revenue growth of 167%. The fastest-growing cost line was Other operating costs (+338%). Net earnings were $0.09B, down 40% year over year. The effective tax rate was 24.4%.
Operating cash flow was $1.1B (up 122% year over year), 1206% of net earnings. Non-cash charges added back $0.01B of share-based compensation. Working capital and other items added $1.0B. Capital expenditures of $0.71B left free cash flow of $0.41B.
Quarterly history
| Quarter | Form | Filed | Revenue | Y/Y | Op. margin | Net earnings | Op. cash flow |
|---|---|---|---|---|---|---|---|
| Q3 2026 | 10-Q | Nov 4, 2026 | $2.2B | +167% | 10.9% | $93.0M | $1.1B |
| Q2 2026 | 10-Q | Aug 6, 2026 | $2.5B | +215% | 59.8% | $1.1B | $1.1B |
| Q1 2026 | 10-Q | May 7, 2026 | $1.5B | +75% | -20.1% | −$335M | $640M |
| Q4 2025 | 10-K | Feb 26, 2026 | $705M | -17% | 25.8% | $109M | $452M |
| Q3 2025 | 10-Q | Nov 3, 2025 | $812M | +26% | 30.3% | $155M | $505M |
| Q2 2025 | 10-Q | Aug 1, 2025 | $793M | +25% | 37.2% | $202M | $571M |
| Q1 2025 | 10-Q | May 2, 2025 | $845M | +51% | 32.7% | $182M | $483M |
Charts
Interactive views
The same charts as the app — open one to draw it.
💵Where each $1 goesinteractive
Loading the interactive chart…
🌏Named in Asian annual reportsinteractive
Loading the interactive chart…
🔄Rotation against the market and its industry (RRG)interactive
Loading the interactive chart…
🔍Earnings qualityinteractive
Loading the interactive chart…
⚖️Fair value by methodinteractive
Loading the interactive chart…
🔭Outlook & guidanceinteractive
Loading the interactive chart…
📈Investments: gains and what it boughtinteractive
Loading the interactive chart…
🏭Its industry’s money flow (input-output)interactive
Loading the interactive chart…
About SM Energy
SM is a premier, scaled operator of top-tier oil and gas assets across four leading U.S. shale basins: the Permian Basin, DJ Basin, South Texas, and Uinta Basin. SM routinely posts important information about the Company on its website. SM is focused on operational excellence, disciplined capital allocation, and delivering growing returns to stockholders. For more information, visit www.sm-energy.com.
In its own words, from its 8-K, filed Aug 5, 2026.
SM Energy against its Crude Petroleum & Natural Gas peers
The largest companies of the same SEC industry, each at its latest quarter. Revenue growth: +167% against the peers' median +48%. Operating margin: 10.9% against the peers' median 33.7%.
| Company | Quarter | Revenue | Y/Y | Op. margin |
|---|---|---|---|---|
| SM SM Energy | Q3 2026 | $2.2B | +167% | 10.9% |
| EOG EOG Resources | Q3 2026 | $8.5B | +46% | 41.9% |
| OXY Occidental Petroleum | Q2 2026 | $8.1B | +53% | 48.5% |
| DVN Devon Energy | Q3 2026 | $6.9B | +58% | 18.3% |
| FANG Diamondback Energy | Q3 2026 | $5.4B | +38% | 46.0% |
| EXE Expand Energy | Q3 2026 | $3.3B | +11% | 19.5% |
| PARR PAR Pacific Holdings | Q3 2026 | $3.1B | +52% | 15.5% |
| OVV Ovintiv | Q3 2026 | $2.6B | +26% | 33.7% |
| PR Permian Resources | Q3 2026 | $2.0B | +48% | 45.4% |
Source: SM Energy 10-Q on SEC EDGAR · CIK 893538 · Crude Petroleum & Natural Gas
Guidance and outlook
13F: who owns SM and who is buying
More on SM
History
Every quarter: Q3 2026 results · Q2 2026 results · Q1 2026 results · Q4 2025 results · Q3 2025 results · Q2 2025 results · Q1 2025 results
- SM Energy guidance history: guided vs reported
- SM Energy operating margin by quarter
- SM Energy net income by quarter
- SM Energy free cash flow by quarter
- SM Energy capital expenditures by quarter
- SM Energy Crude Oil revenue by quarter
- SM Energy Natural Gas revenue by quarter
- SM Energy Natural Gas Liquids (NGL) revenue by quarter