Filing Flows › Energy › PAR Pacific Holdings (PARR)
PAR Pacific Holdings (PARR) earnings and revenue breakdown
Latest: Q3 2026 · 10-Q filed Nov 4, 2026 · PAR Pacific Holdings (PARR) Q3 2026 earnings results →
Q3 2026 Revenue up 52% year over year to $3.1B · 12¢ of every $1 of revenue kept as net profit · operating margin 15.5%
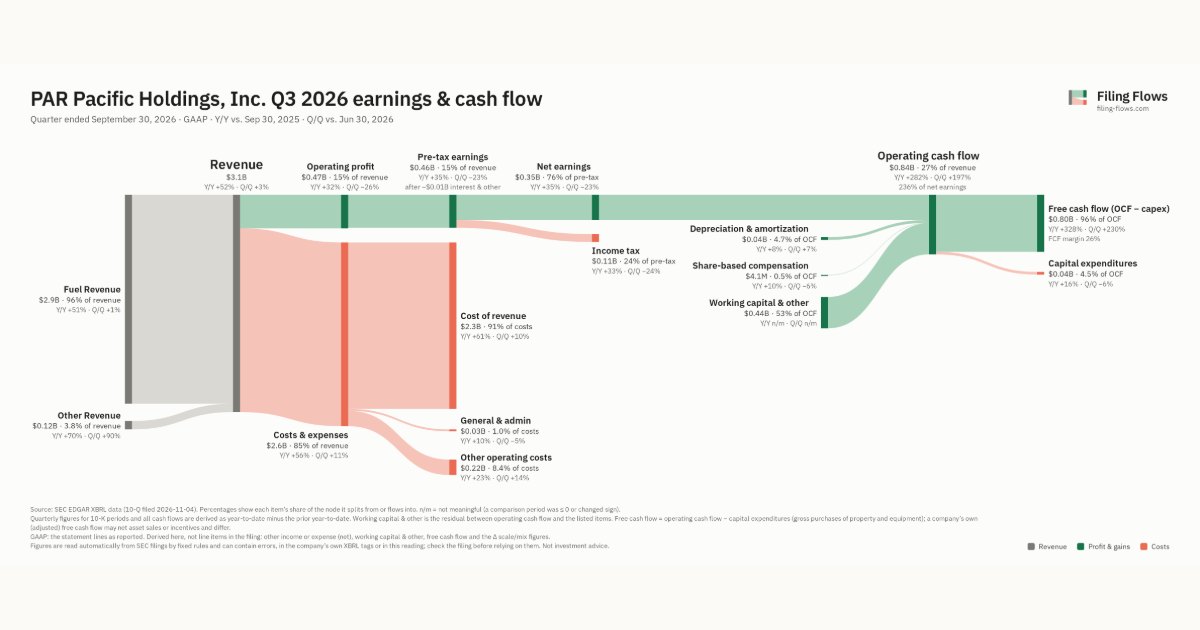
PAR Pacific Holdings made $3.1B in Q3 2026 (+52% Y/Y): Fuel Revenue $2.9B, Other Revenue $117M. Operating margin 15.5%, net earnings $355M. See where every dollar goes — costs, profit and cash — as a Sankey from the 10-Q filed Nov 4, 2026.
Drawing the Sankey…
Open the interactive Sankey → click any line for what the company wrote about it, compare Y/Y and Q/Q, export as PNG or PDF
What changed this quarter
Revenue was $3.1B in Q3 2026, up 52% year over year and up 3% from the previous quarter. Fuel Revenue was the largest line at 96% of revenue. Fuel Revenue added $1.0B year over year (up 51%), 95% of the total change.
Operating profit was $0.47B, a 15.5% margin (down 2.3 points year over year). Of the extra revenue versus Q3 2025, 11% reached operating profit, below the 18% margin then. Total costs grew 56% against revenue growth of 52%. The fastest-growing cost line was Cost of revenue (+61%). Net earnings were $0.35B, up 35% year over year. The effective tax rate was 23.7%.
Operating cash flow was $0.84B (up 282% year over year), 236% of net earnings. Non-cash charges added back $0.04B of depreciation and amortization and $4.1M of share-based compensation. Working capital and other items added $0.44B. Capital expenditures of $0.04B left free cash flow of $0.80B.
Quarterly history
| Quarter | Form | Filed | Revenue | Y/Y | Op. margin | Net earnings | Op. cash flow |
|---|---|---|---|---|---|---|---|
| Q3 2026 | 10-Q | Nov 4, 2026 | $3.1B | +52% | 15.5% | $355M | $839M |
| Q2 2026 | 10-Q | Aug 5, 2026 | $3.0B | +57% | 21.4% | $462M | $283M |
| Q1 2026 | 10-Q | May 6, 2026 | $1.8B | +4% | 3.6% | $54.5M | −$40.7M |
| Q4 2025 | 10-K | Feb 25, 2026 | $1.8B | -1% | 5.5% | $77.7M | $93.8M |
| Q3 2025 | 10-Q | Nov 5, 2025 | $2.0B | -6% | 17.8% | $263M | $219M |
| Q2 2025 | 10-Q | Aug 6, 2025 | $1.9B | -6% | 5.1% | $59.5M | $134M |
| Q1 2025 | 10-Q | May 8, 2025 | $1.7B | -12% | -0.9% | −$30.4M | −$1.4M |
Charts
Interactive views
The same charts as the app — open one to draw it.
💵Where each $1 goesinteractive
Loading the interactive chart…
🌏Named in Asian annual reportsinteractive
Loading the interactive chart…
🔄Rotation against the market and its industry (RRG)interactive
Loading the interactive chart…
🔍Earnings qualityinteractive
Loading the interactive chart…
⚖️Fair value by methodinteractive
Loading the interactive chart…
🔭Outlook & guidanceinteractive
Loading the interactive chart…
📈Investments: gains and what it boughtinteractive
Loading the interactive chart…
🏭Its industry’s money flow (input-output)interactive
Loading the interactive chart…
About PAR Pacific Holdings
Par Pacific Holdings, Inc., headquartered in Houston, Texas, is a growth-oriented energy company providing both renewable and conventional fuels to the western United States. 1) Refining - We own and operate four refineries with total operating crude oil throughput capacity of 219 Mbpd. Our refineries in Kapolei, Hawaii, Newcastle, Wyoming, Tacoma, Washington, and Billings, Montana, convert crude oil into gasoline, distillate, asphalt and other products to serve the state of Hawaii and areas ranging from Washington state to the Dakotas and Wyoming.
In its own words, from its 10-K, filed Feb 25, 2026.
PAR Pacific Holdings against its Crude Petroleum & Natural Gas peers
The largest companies of the same SEC industry, each at its latest quarter. Revenue growth: +52% against the peers' median +48%. Operating margin: 15.5% against the peers' median 33.7%.
| Company | Quarter | Revenue | Y/Y | Op. margin |
|---|---|---|---|---|
| PARR PAR Pacific Holdings | Q3 2026 | $3.1B | +52% | 15.5% |
| EOG EOG Resources | Q3 2026 | $8.5B | +46% | 41.9% |
| OXY Occidental Petroleum | Q2 2026 | $8.1B | +53% | 48.5% |
| DVN Devon Energy | Q3 2026 | $6.9B | +58% | 18.3% |
| FANG Diamondback Energy | Q3 2026 | $5.4B | +38% | 46.0% |
| EXE Expand Energy | Q3 2026 | $3.3B | +11% | 19.5% |
| OVV Ovintiv | Q3 2026 | $2.6B | +26% | 33.7% |
| SM SM Energy | Q3 2026 | $2.2B | +167% | 10.9% |
| PR Permian Resources | Q3 2026 | $2.0B | +48% | 45.4% |
Source: PAR Pacific Holdings 10-Q on SEC EDGAR · CIK 821483 · Crude Petroleum & Natural Gas
Guidance and outlook
13F: who owns PARR and who is buying
More on PARR
- How PAR Pacific Holdings makes money: revenue by segment
- PAR Pacific Holdings next earnings date and what analysts expect
- PAR Pacific Holdings stock forecast, price target and fair value
- Who owns PAR Pacific Holdings stock: holders, funds and Congress trades
- PAR Pacific Holdings guidance and outlook
- Is PAR Pacific Holdings a takeover target? LBO and rumors
History
Every quarter: Q3 2026 results · Q2 2026 results · Q1 2026 results · Q4 2025 results · Q3 2025 results · Q2 2025 results · Q1 2025 results